One place to plan, approve and track plant shutdowns across ADNOC's sites. Built with IBM iX for one of the world's largest oil & gas companies.
tams.adnoc.ae
Client
ADNOC · via IBM iX
My role
UI Designer
Platform
Web + Mobile
Duration
6 months
Tools
Figma
Challenge
Turnaround data was spread across sites and manual processes, with no single view of shutdowns or approvals.
What I did
Designed enterprise UI across web and mobile, four page templates and seven new design-system components.
Outcome
A single source of truth for turnarounds, well received by stakeholders and aligned with ADNOC's standards.
Project overview
The “Turnaround Management System”, or TAMS for short is a project management platform designed by IBM iX for a prominent 12th Largest oil & gas company. Turnaround management system is a term in project management used to describe the revitalization of struggling procedures or companies by analyzing issues and creating strategic plans and implementing changes to restore efficiency.
Discipline: Product Design
6Lifecycle phases, from continuous planning to post-T/A
4Page templates behind every screen
7Custom components added to the ADNOC design system
2Platforms: desktop app and a read-only mobile companion
Problem & solution
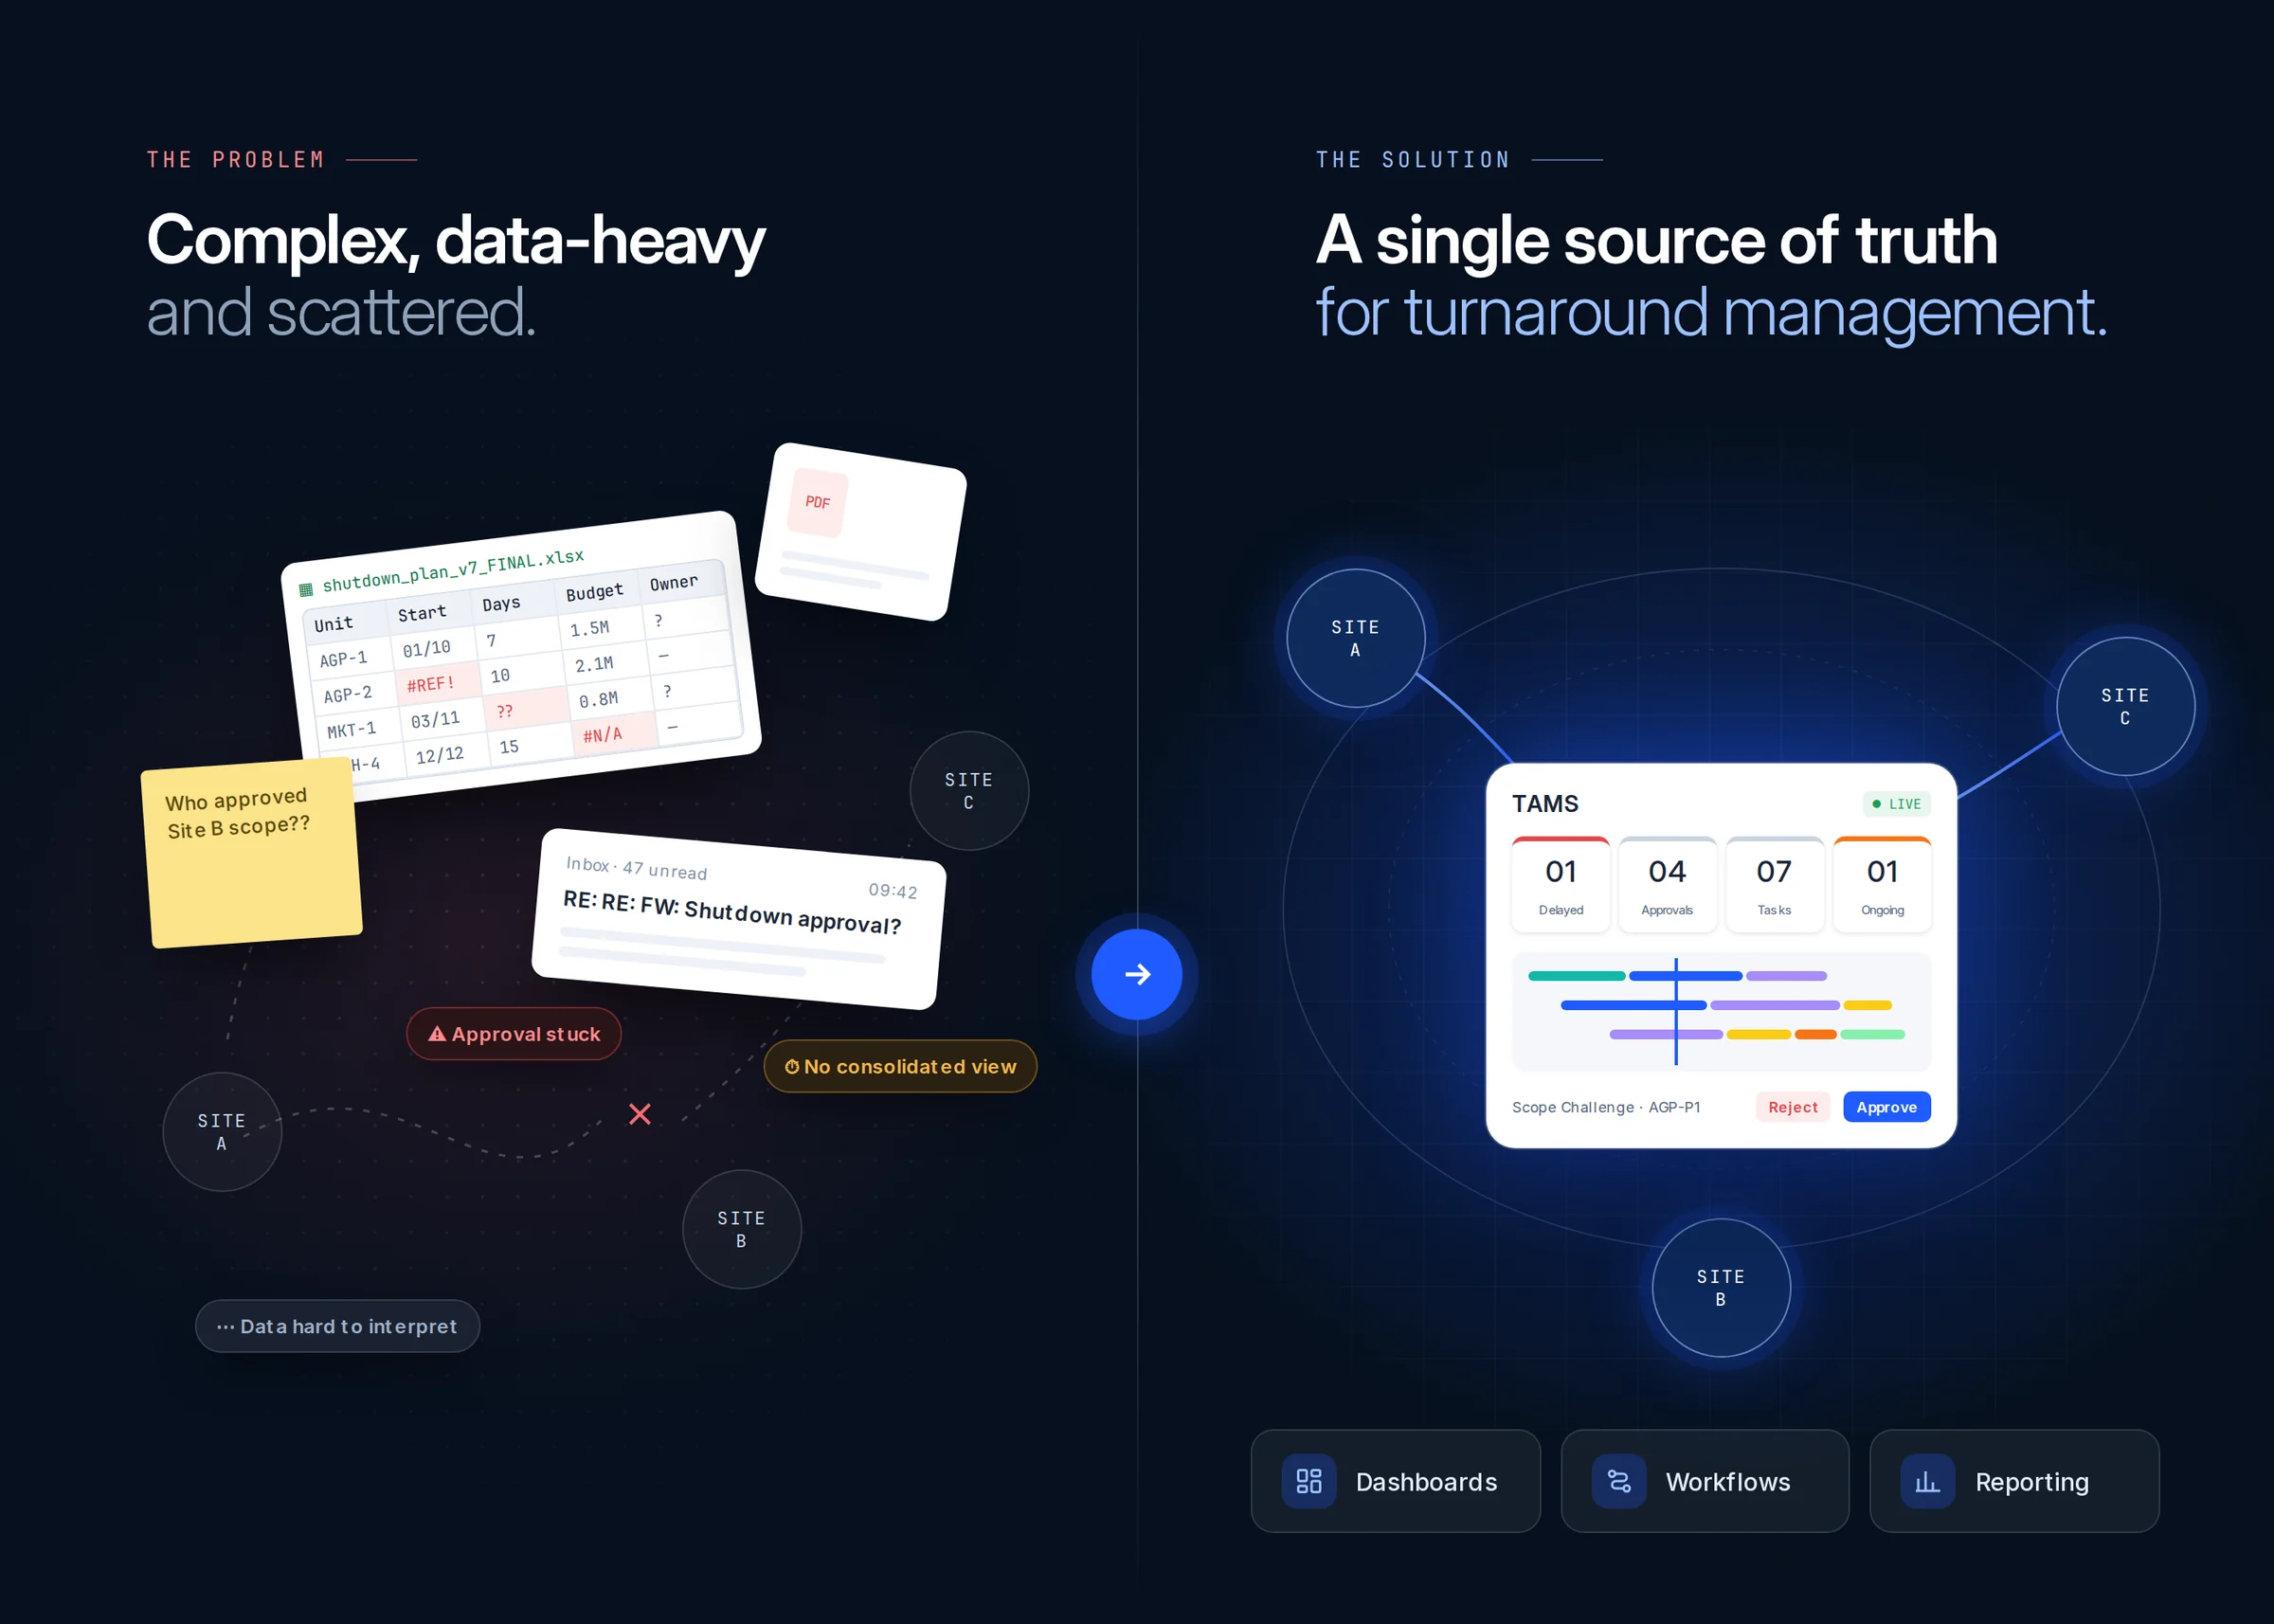
Complex, data-heavy, scattered. Then one source of truth.
The problem
Managing turnaround operations across locations was complex and data-heavy. Existing tools lacked usability and a consolidated view, making it difficult to track shutdowns, manage approvals, and interpret operational data efficiently. The challenge was to present large volumes of operational data in a way that remained clear, consistent, and actionable for enterprise users.
The solution
TAMS introduced a centralized, enterprise-grade system offering a single source of truth for turnaround management. Structured dashboards, clear workflows, and data-driven reporting enabled teams to monitor and manage shutdowns more effectively across locations.
Users & lifecycle
Three roles, six phases, one system.
T/A team member
Fills in process forms (scope, budget, risk, materials) and submits them for review.
Desktop · edit
Reviewer / Manager
Challenges scope, then approves, rejects or returns requests, often away from a desk.
Desktop + mobile · approve
Stakeholders
Track progress and KPIs across sites; processes they don't own open read-only.
Desktop + mobile · view
The turnaround lifecycle
P1
Continuous planning
Long-term T/A plans, team formation, strategy
P2
Concept
Scope list, budget, long-lead materials
P3
Definition
Scope freeze and challenge, contracting
P4
Detailed planning
Procurement, HSE plans, job packs
P5
Execution
Progress monitoring, emergent jobs
P6
Post T/A
Close-out, cost review, lessons learned
Architecture
Four page templates carry the whole system.
Every process fits one of four templates. That kept screens consistent and let engineering render pages faster with template engines.
TEMPLATE 01
Landing · all T/As
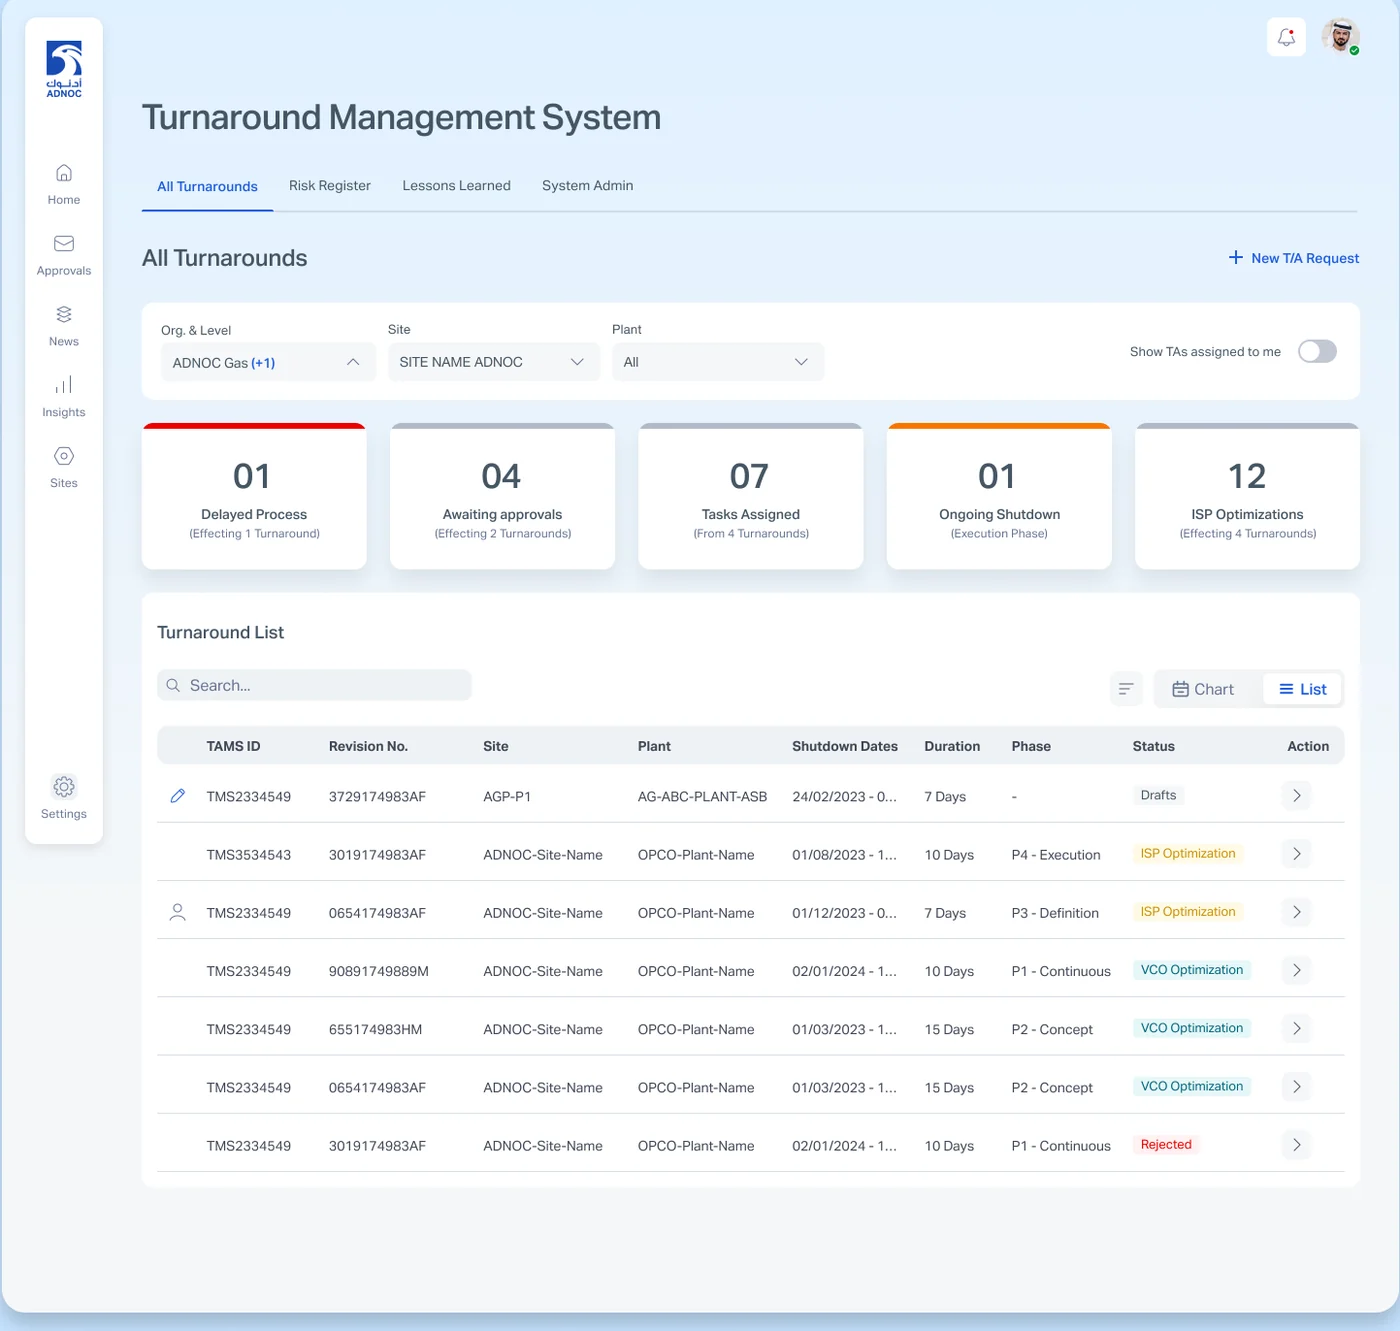
KPIs and every turnaround, pre-filtered to the user's company and site.
TEMPLATE 02
Turnaround overview
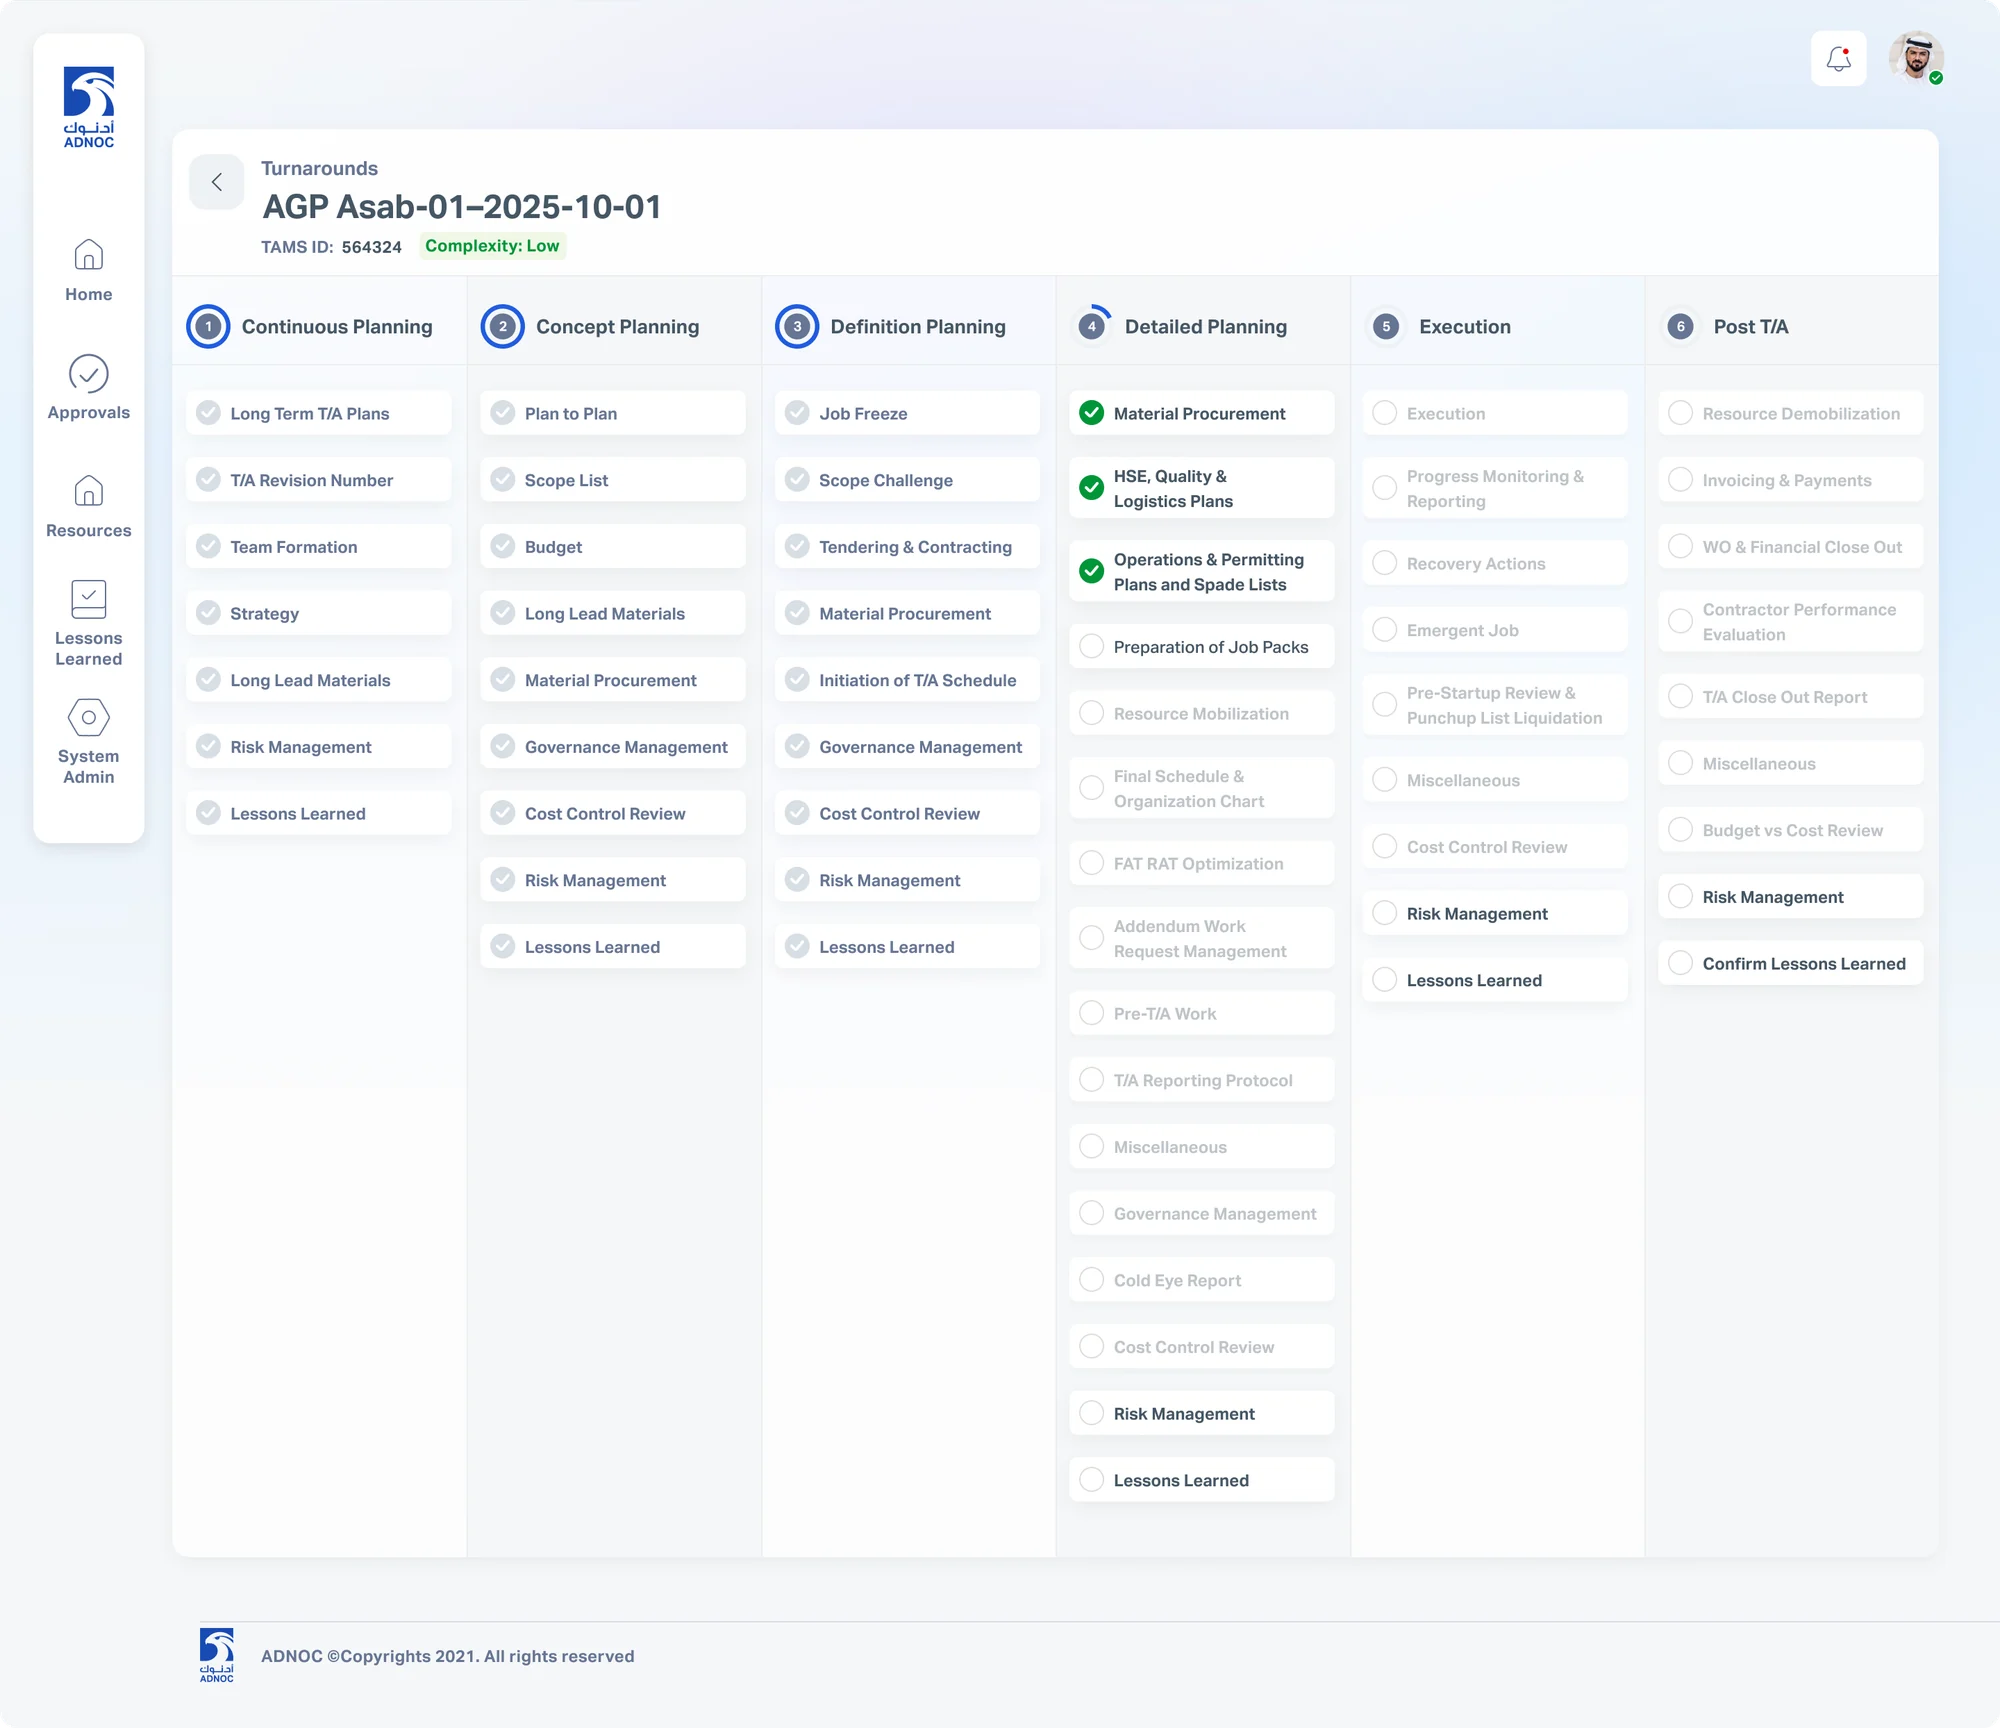
A phase-by-phase checklist that highlights what's assigned to you.
TEMPLATE 03
Process form
Long forms split into sections with a sticky stepper; tabs hold sub-forms.
TEMPLATE 04
Review summary
A read-only check with the approval chain and role-based actions.
We focused on digitizing manual processes by creating a system that structures turnarounds into events, allowing for assigning teams, flagging issues, generating reports and logging lessons learned
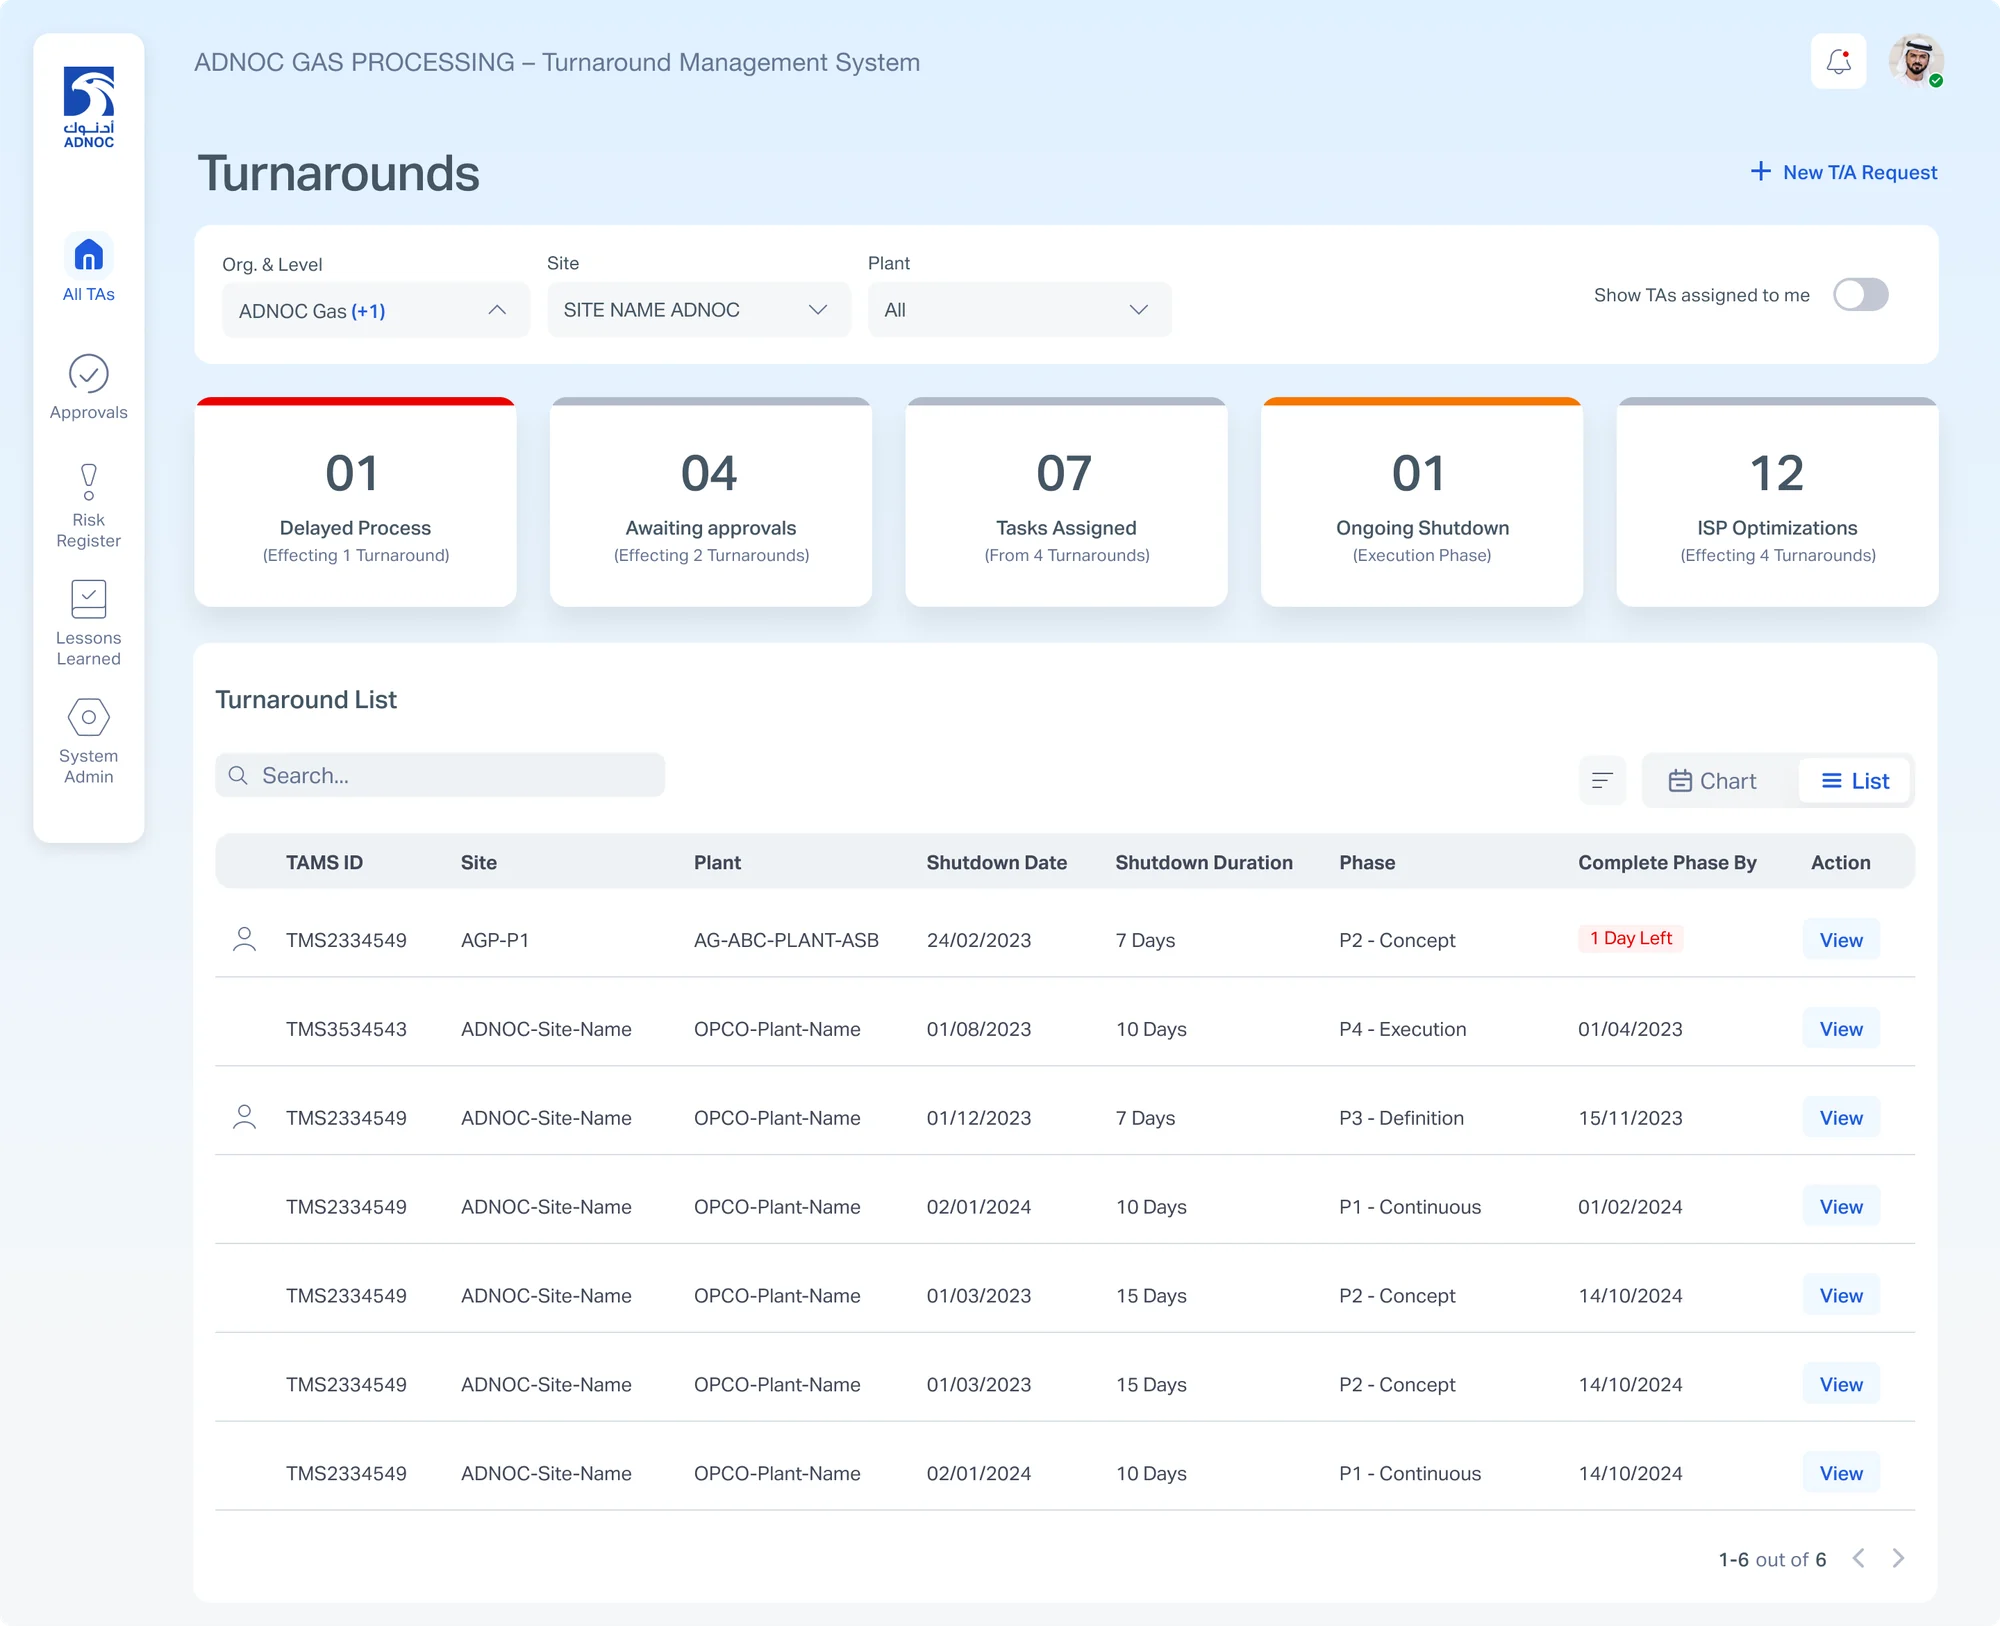
Landing page
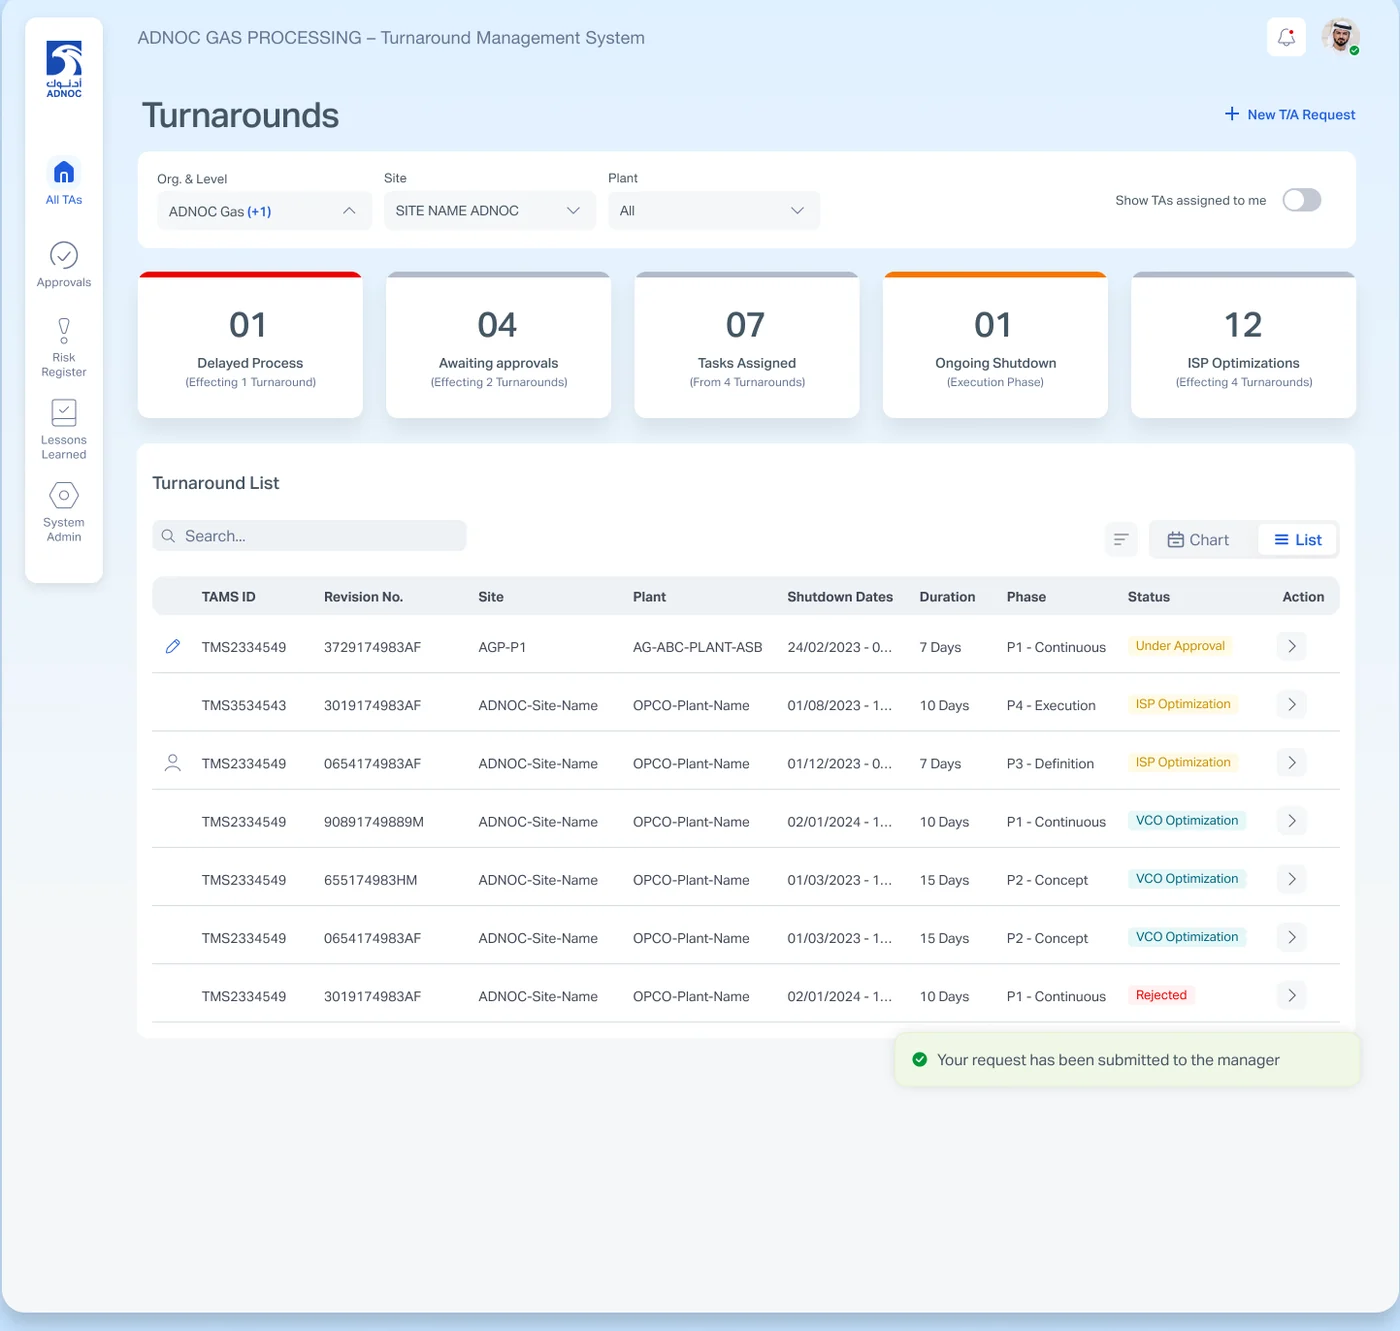
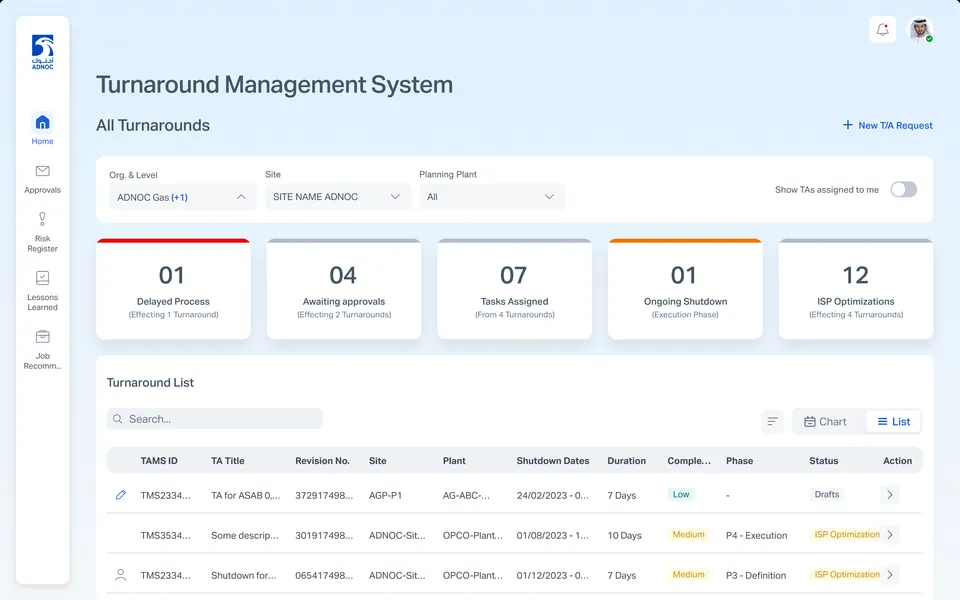
Company, site and plant come pre-selected. An “assigned to me” toggle, colour-coded KPIs and attention flags surface what needs action first.
Two views, one dataset
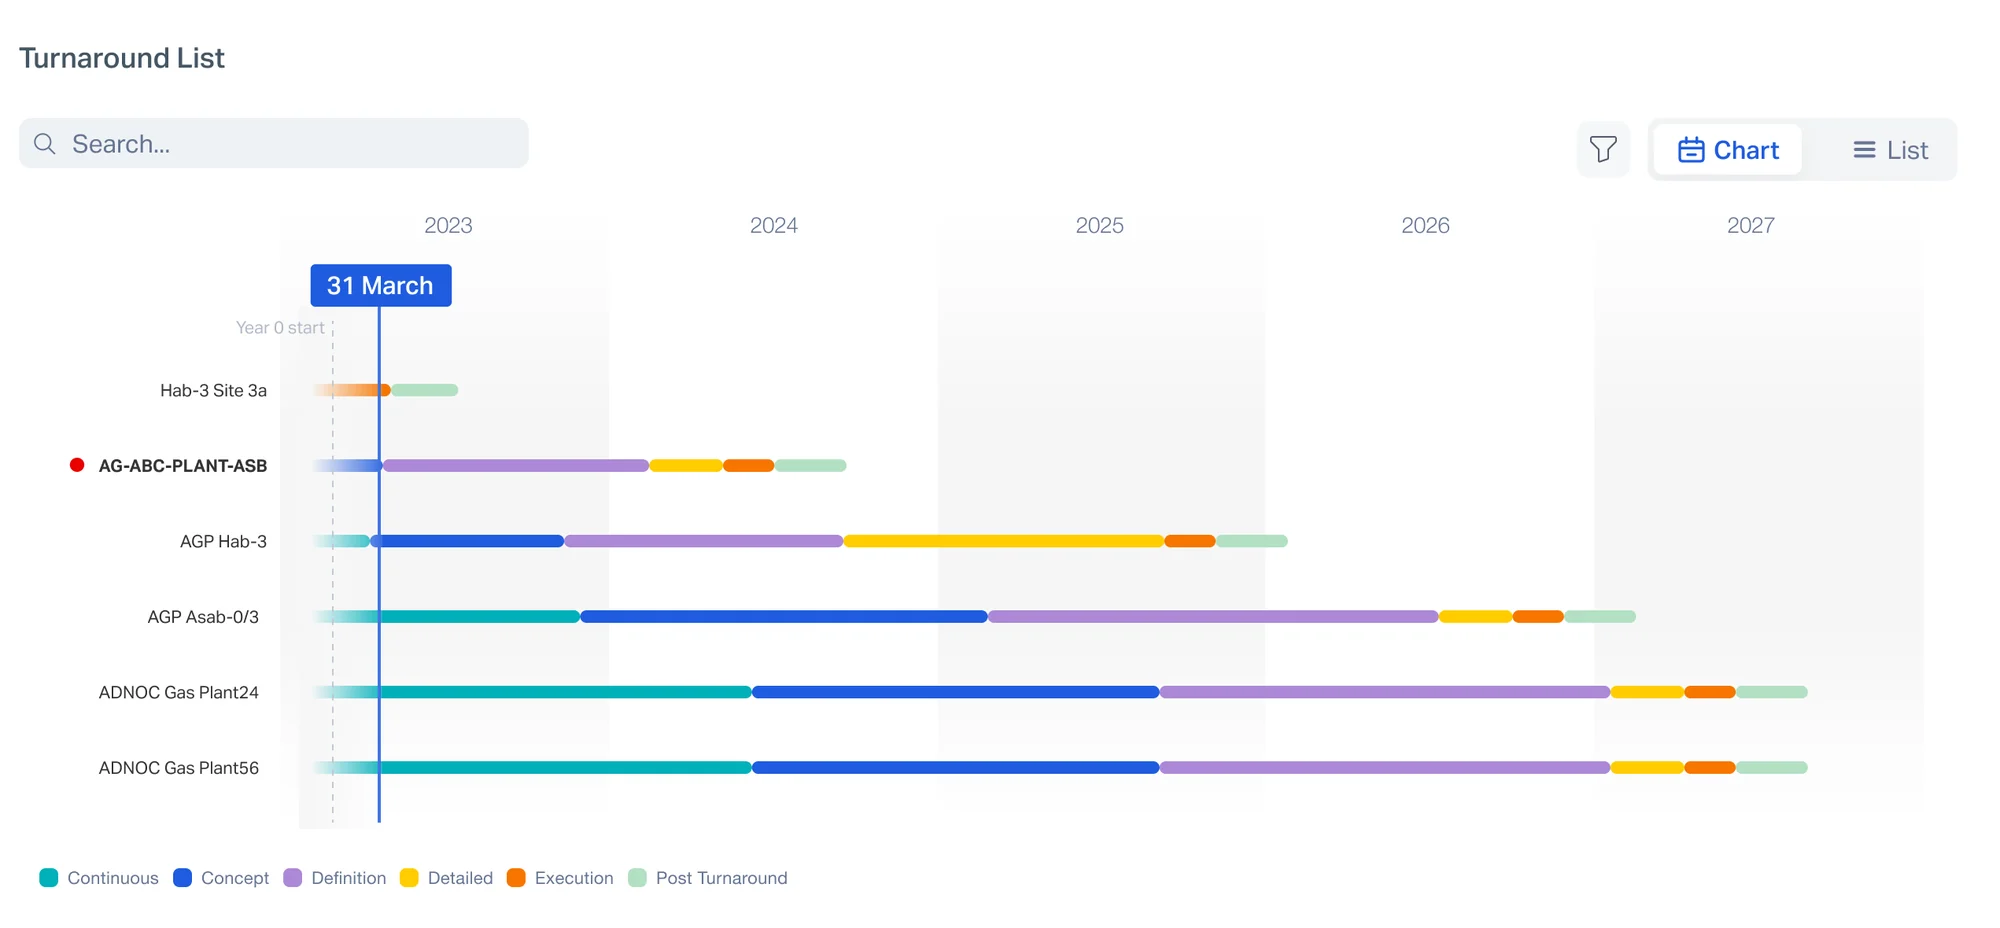
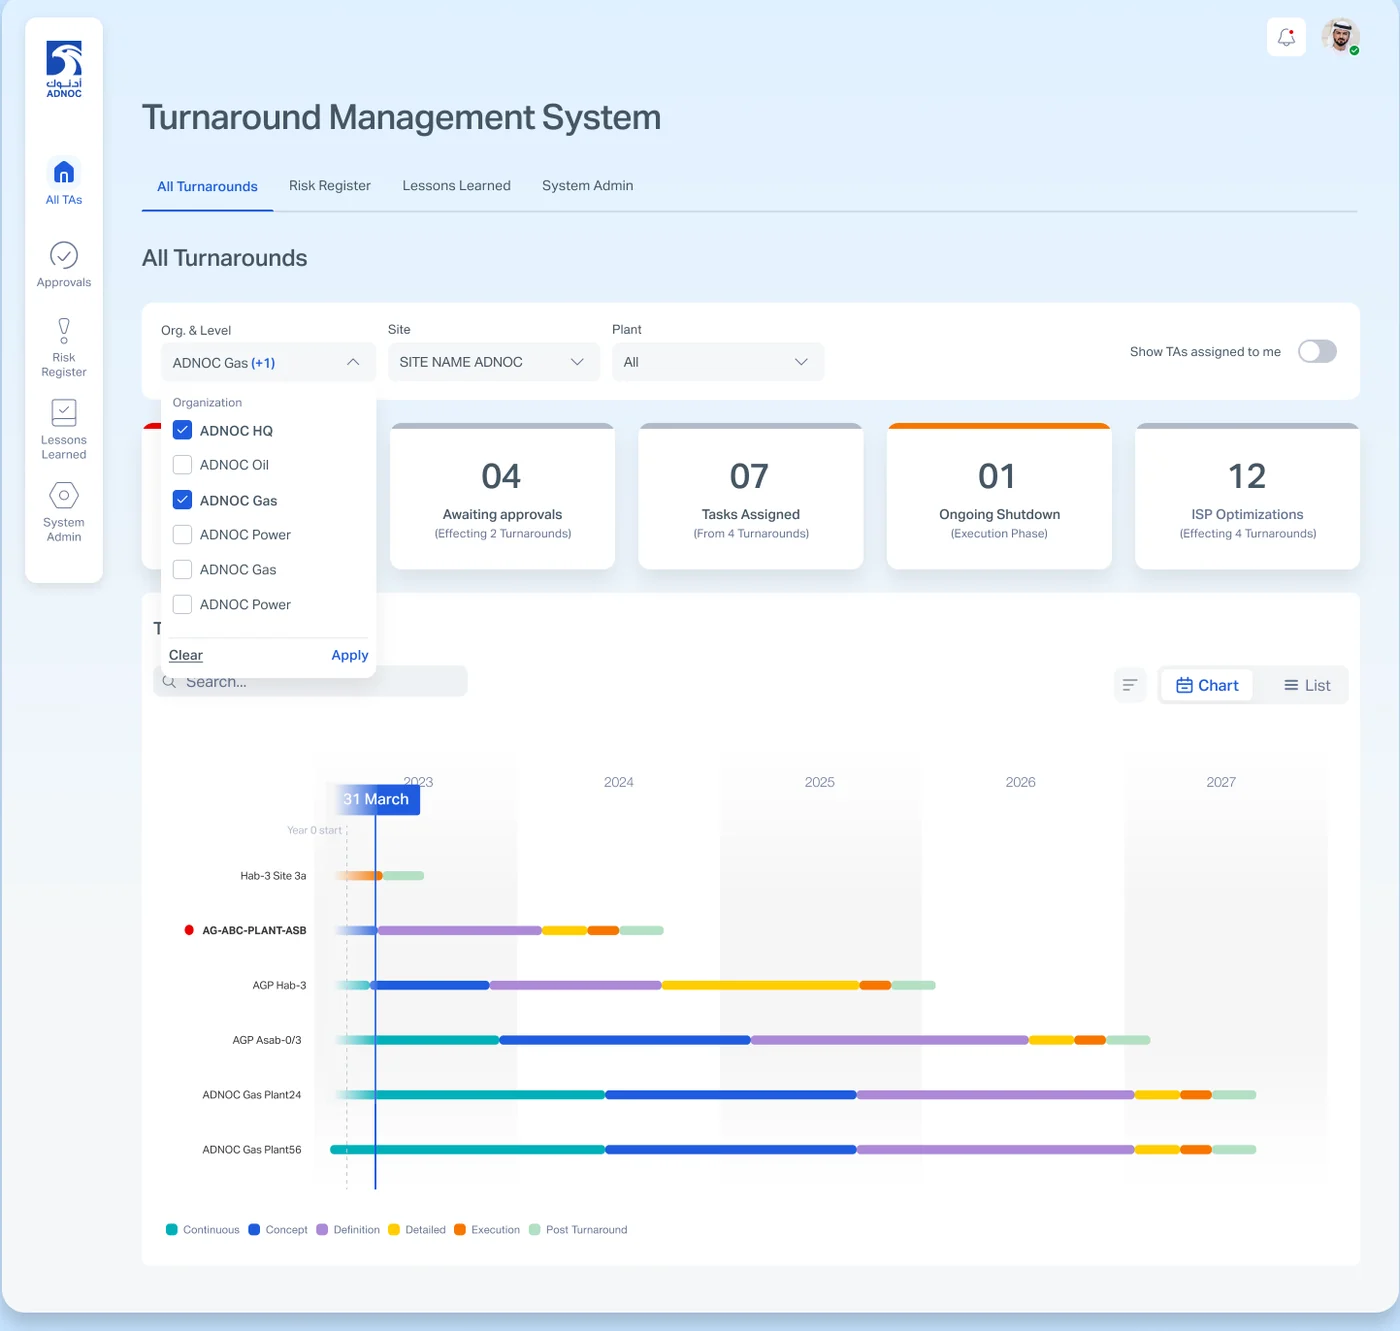
Planners think in rows, leadership thinks in time. The Gantt view colour-codes all six phases, so overlapping shutdowns stand out.
Turnaround overview
All six phases side by side. Finished work is ticked, your tasks are outlined in blue, and processes you can't edit open read-only.
AGP Asab-01 · overview
Process status card
One component, eight states
Lessons Learned
Default
Lessons Learned
In progress
Lessons LearnedAssigned to you
Assigned to you
!Lessons LearnedAwaiting approval
Awaiting approval
!Lessons LearnedReapply the form
Returned
✓Lessons Learned
Completed
✓Lessons Learned
Phase complete
Lessons Learned
Not applicable yet
Create Request
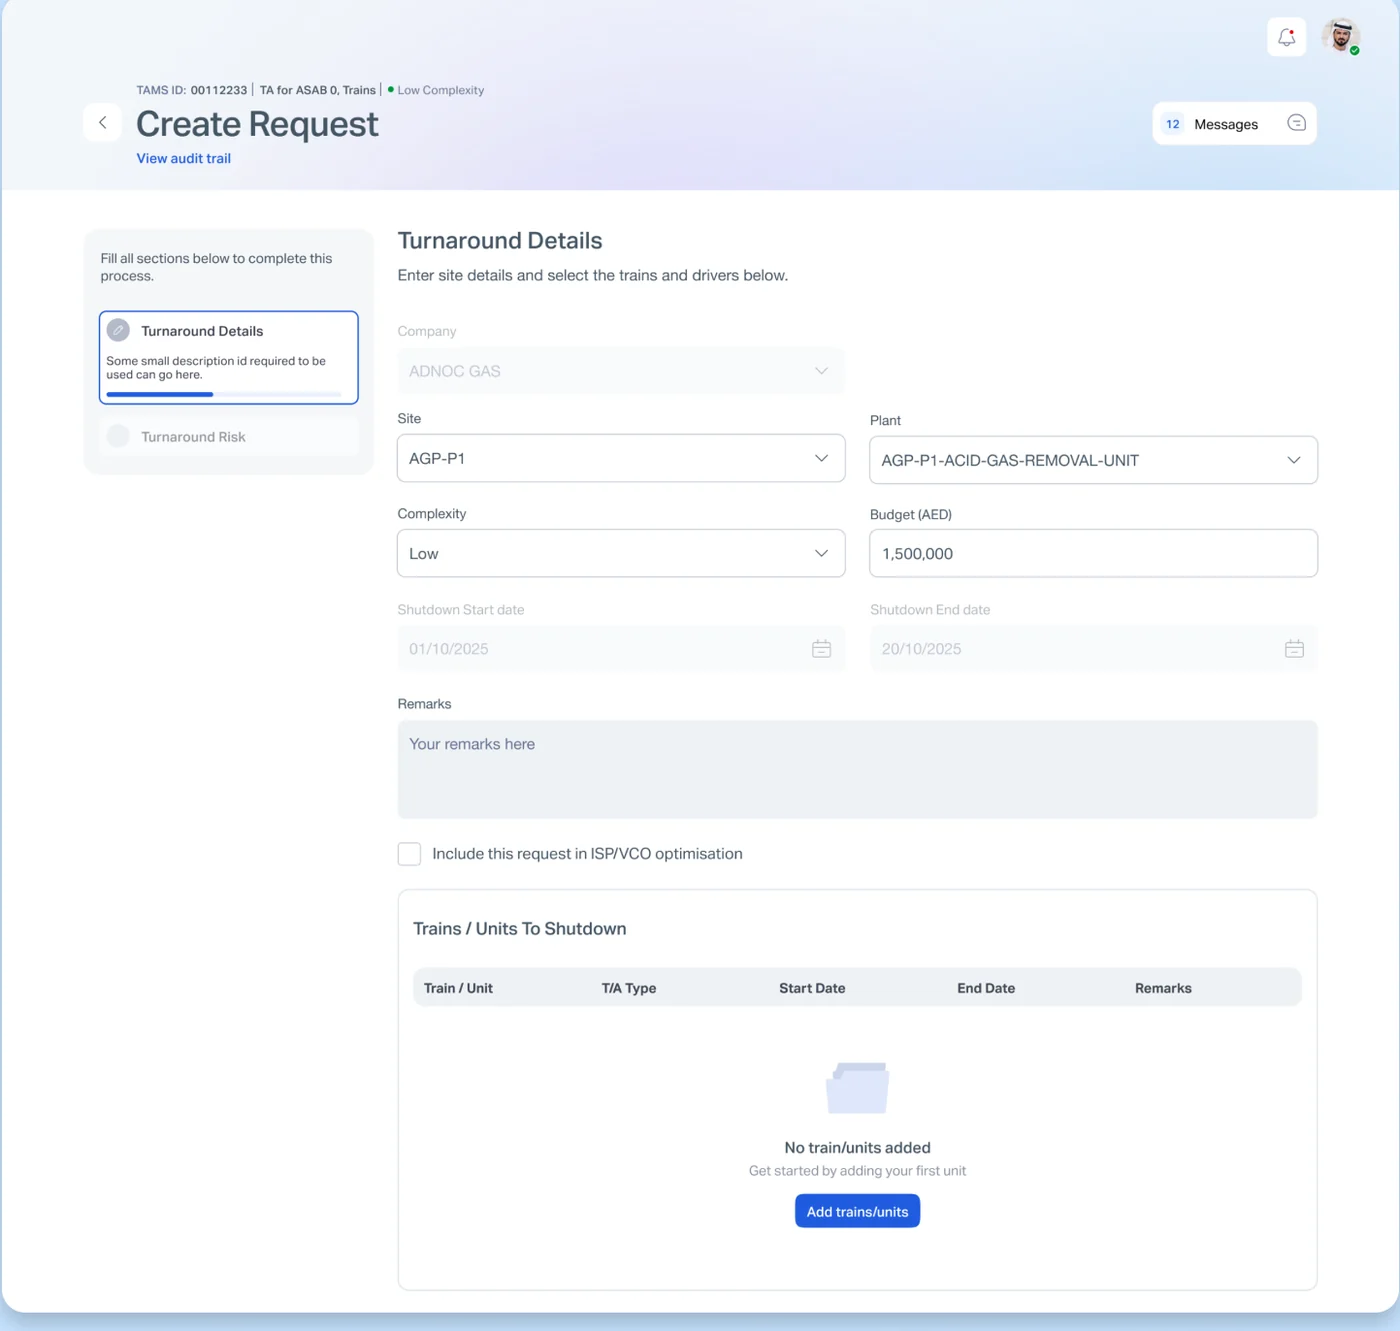
To create a new turnaround request, the user must assign complexity, date, budget, affected units and risk factors
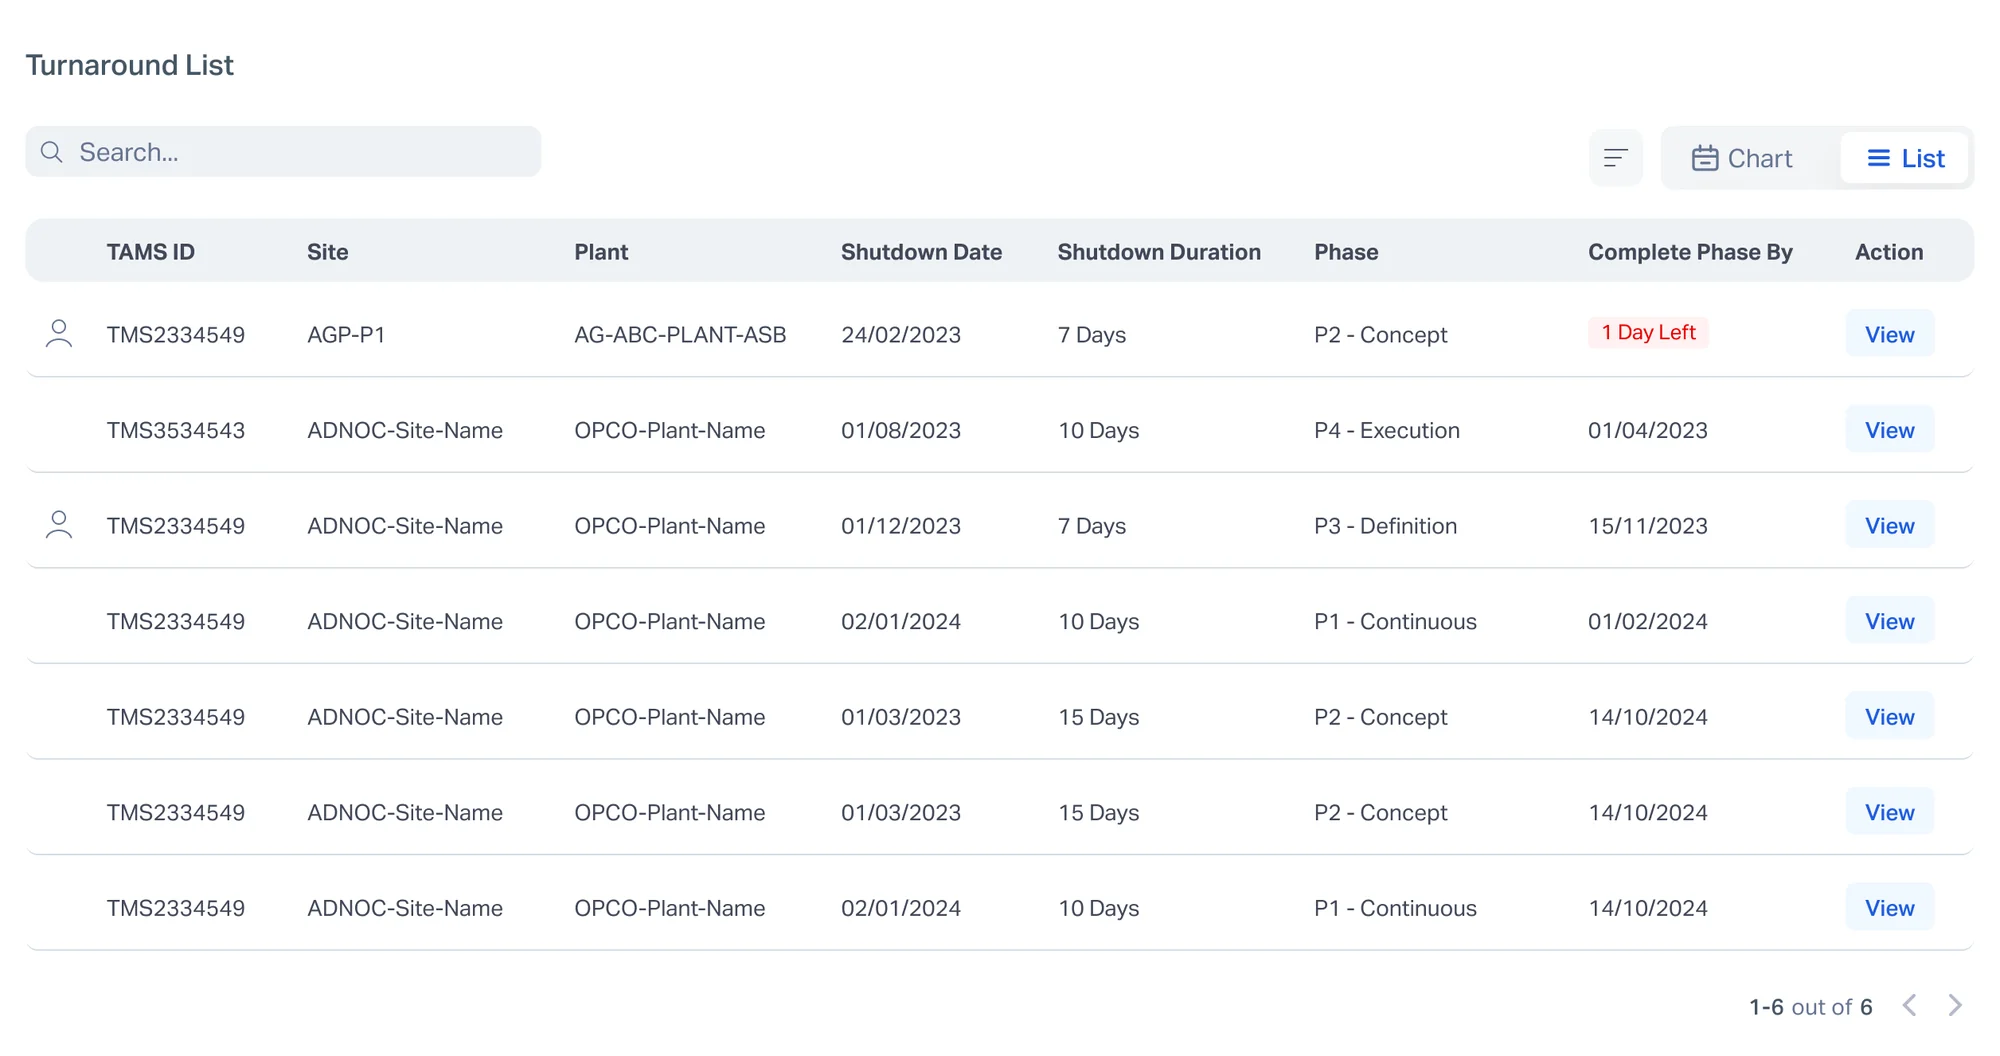
All Turnarounds List ViewList view of all scheduled turnarounds, with the ability to create a new turnaround request
All Turnarounds Chart ViewChart view of all scheduled turnarounds, illustrating which phase the T/A is in currently
Create RequestUser begins the process by specifying the affected site, complexity, budget and the train (units) to be shutdown
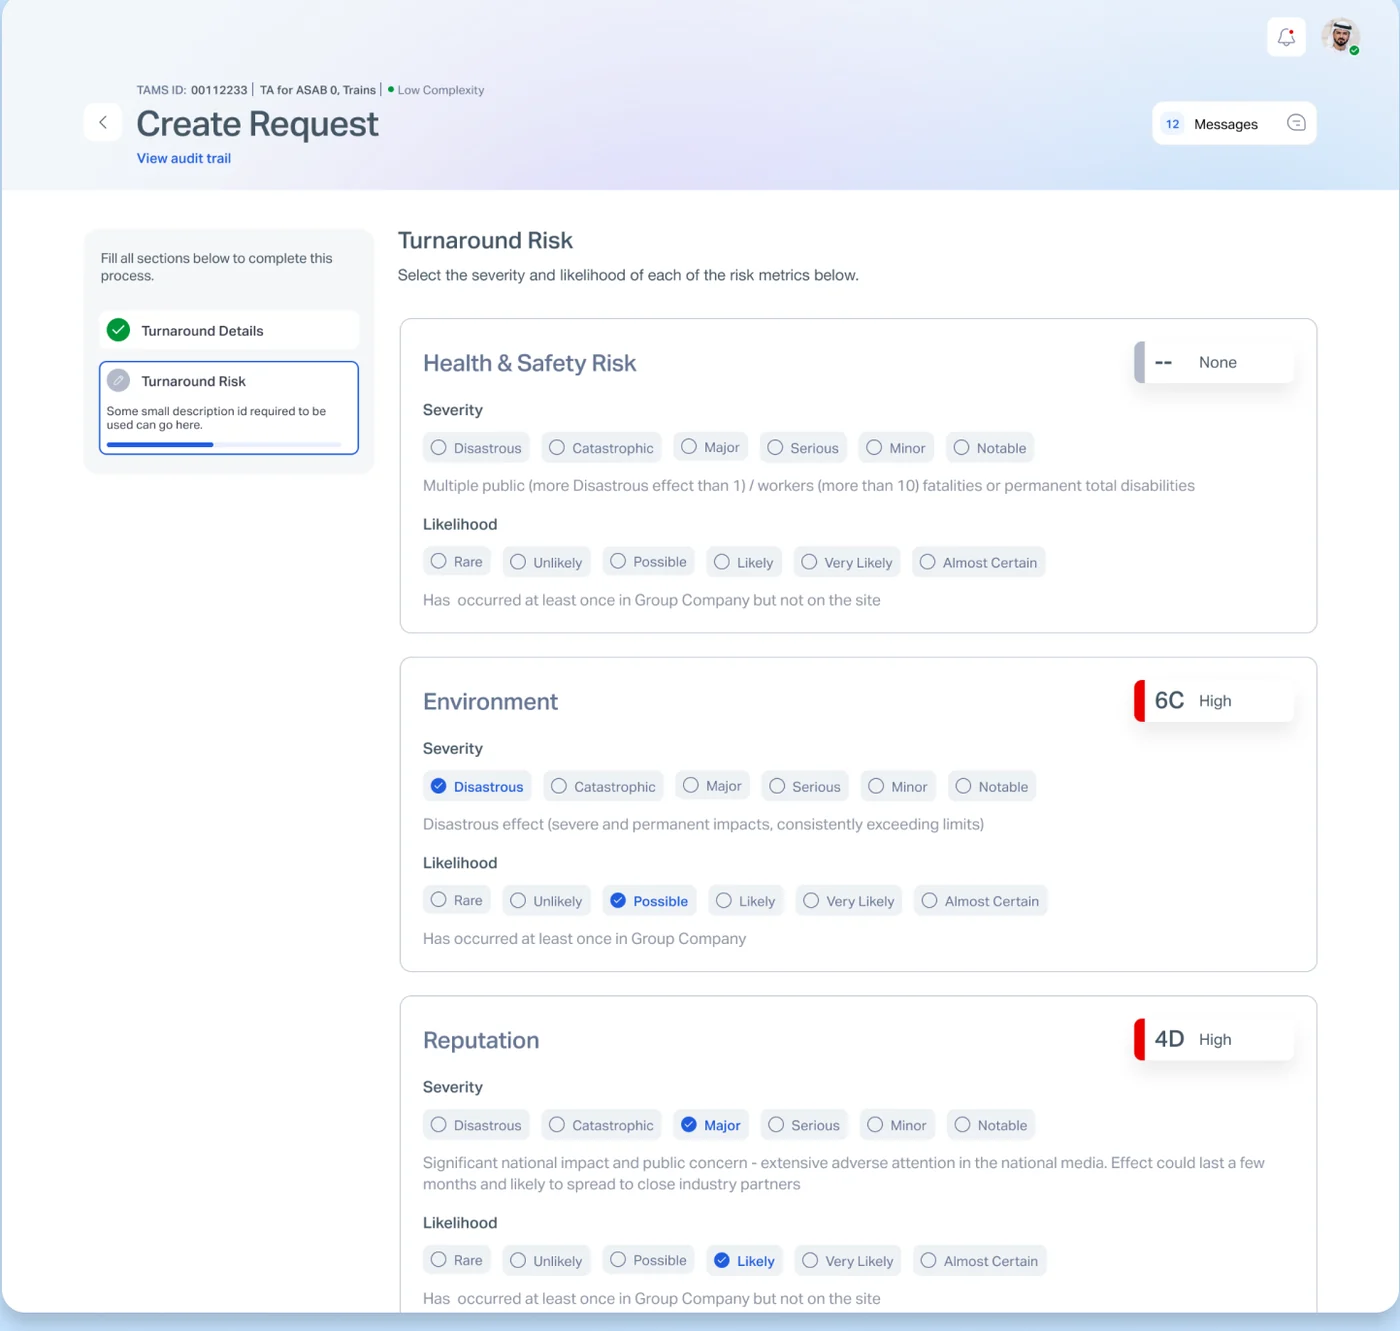
Turnaround RiskRisk assessment is required for each turnaround, in regard to health & safety, environment, reputation, financial and legal
All TurnaroundsOnce the request is created, manager is unified to review and approve the request
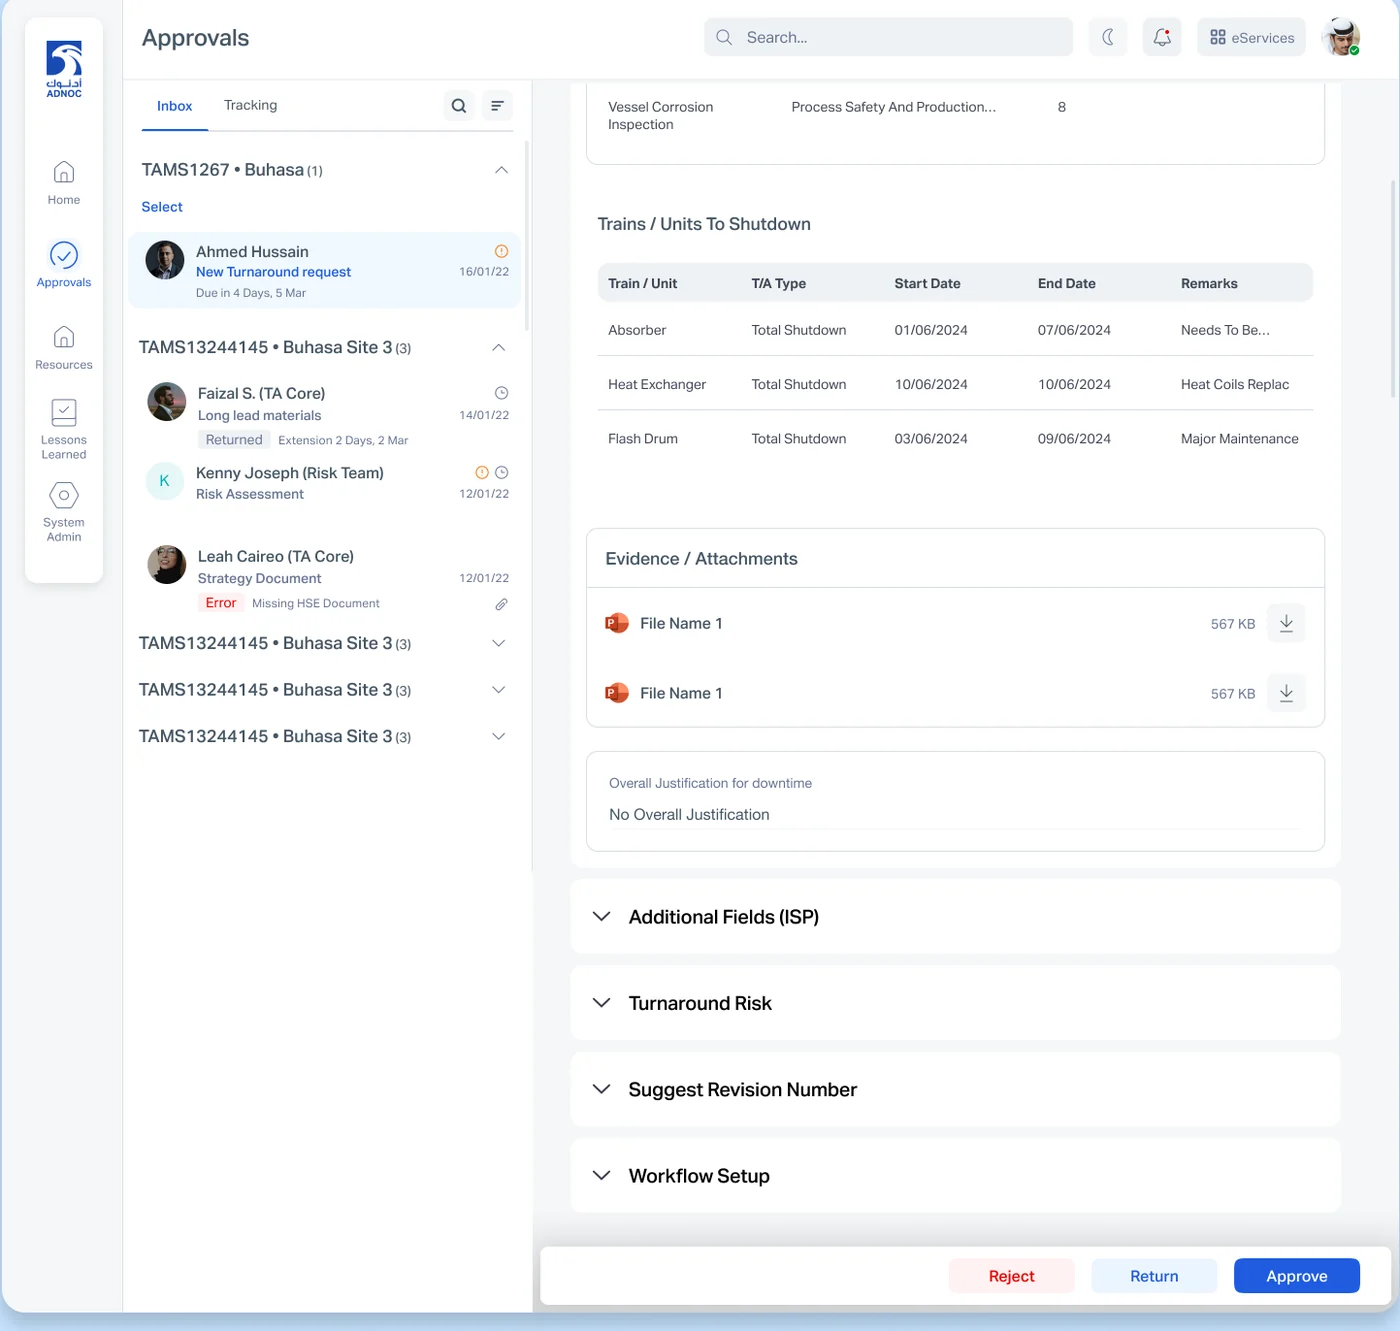
Approval InboxManager is able to view the documentation and timeline of the requested timeline with the ability to approve, reject, or return the request with comments or modifications
Approval Process
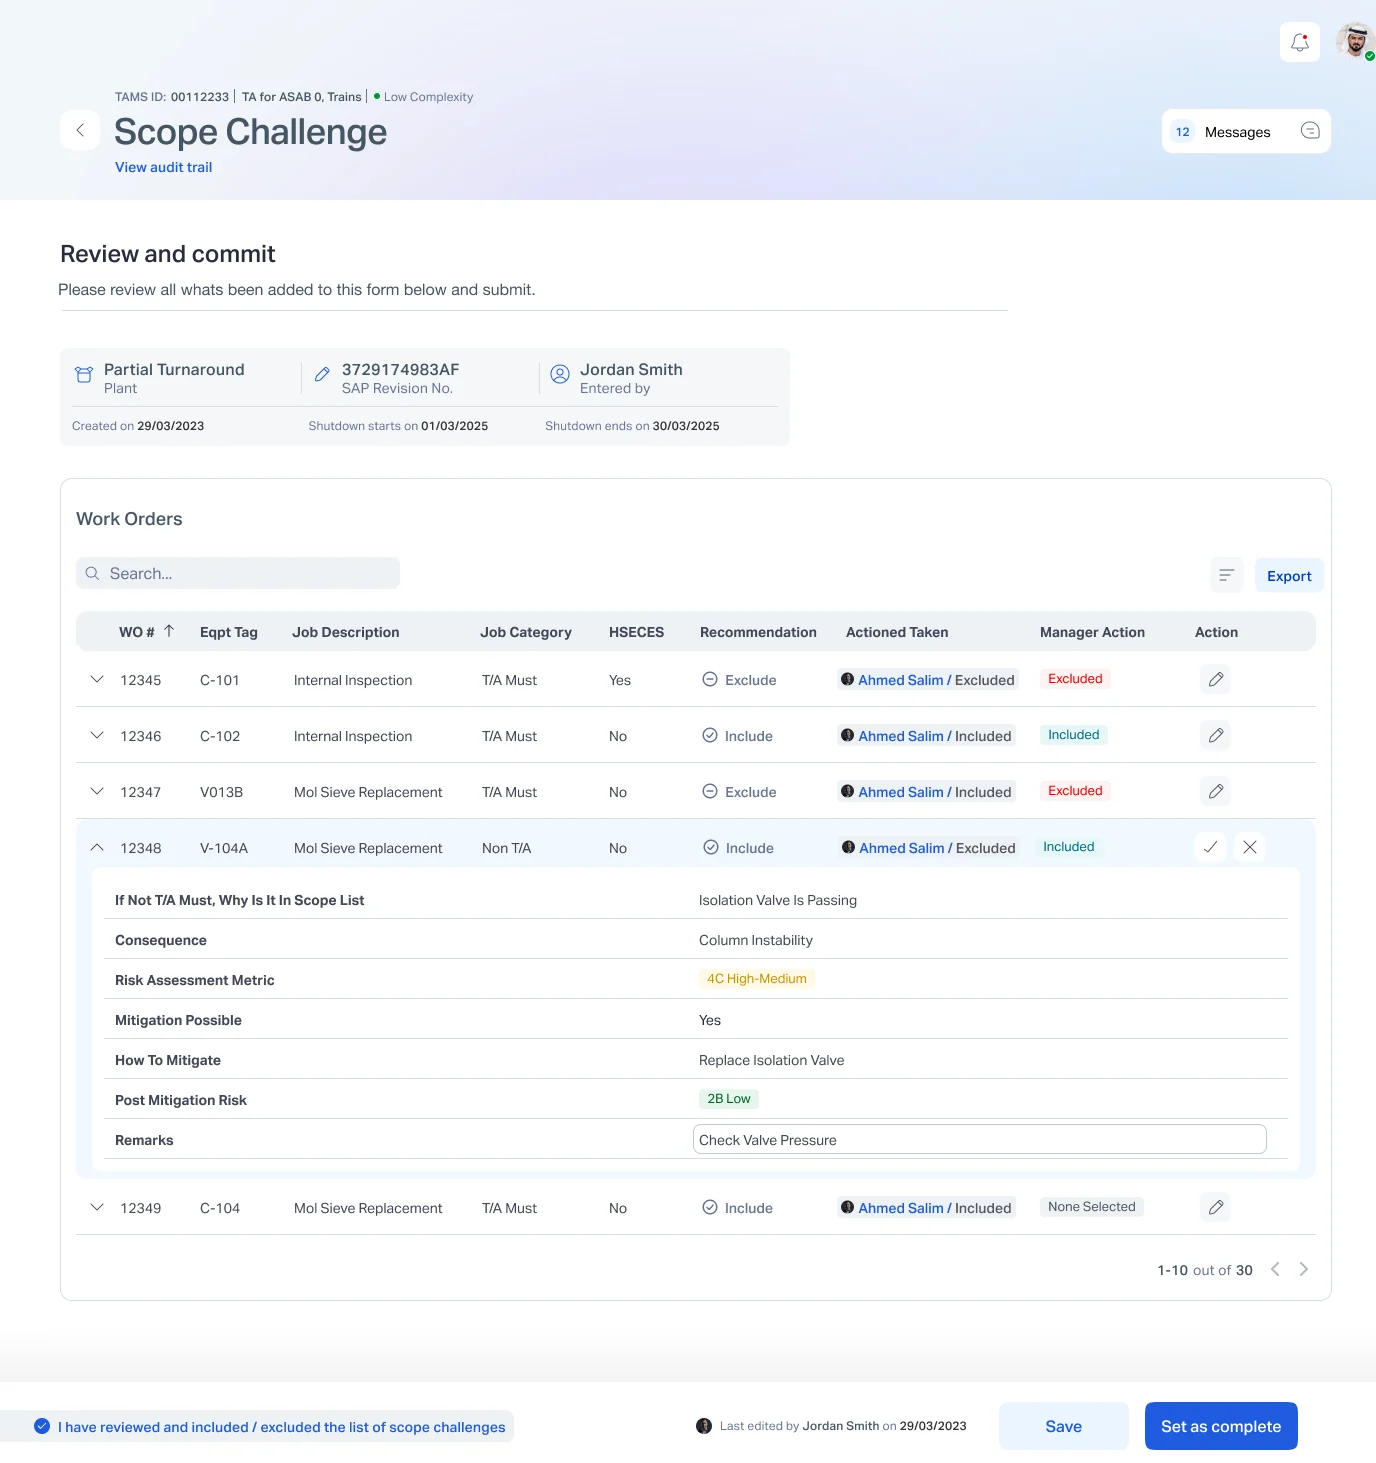
Managers retain the right to challenge the scope of a turnaround, exclude work orders, and monitor the previous reviews and remarks
Scope challenge
Before scope is frozen, managers go through each work order line by line.
Work orders
Include or exclude each one from the current turnaround.
Inline risk
Consequence, risk metric and mitigation stay in the row.
Digital signature
A confirmation checkbox records the manager's sign-off.
Export
Every editable table exports for documentation and reporting.
Scope challenge
Reports & information processes
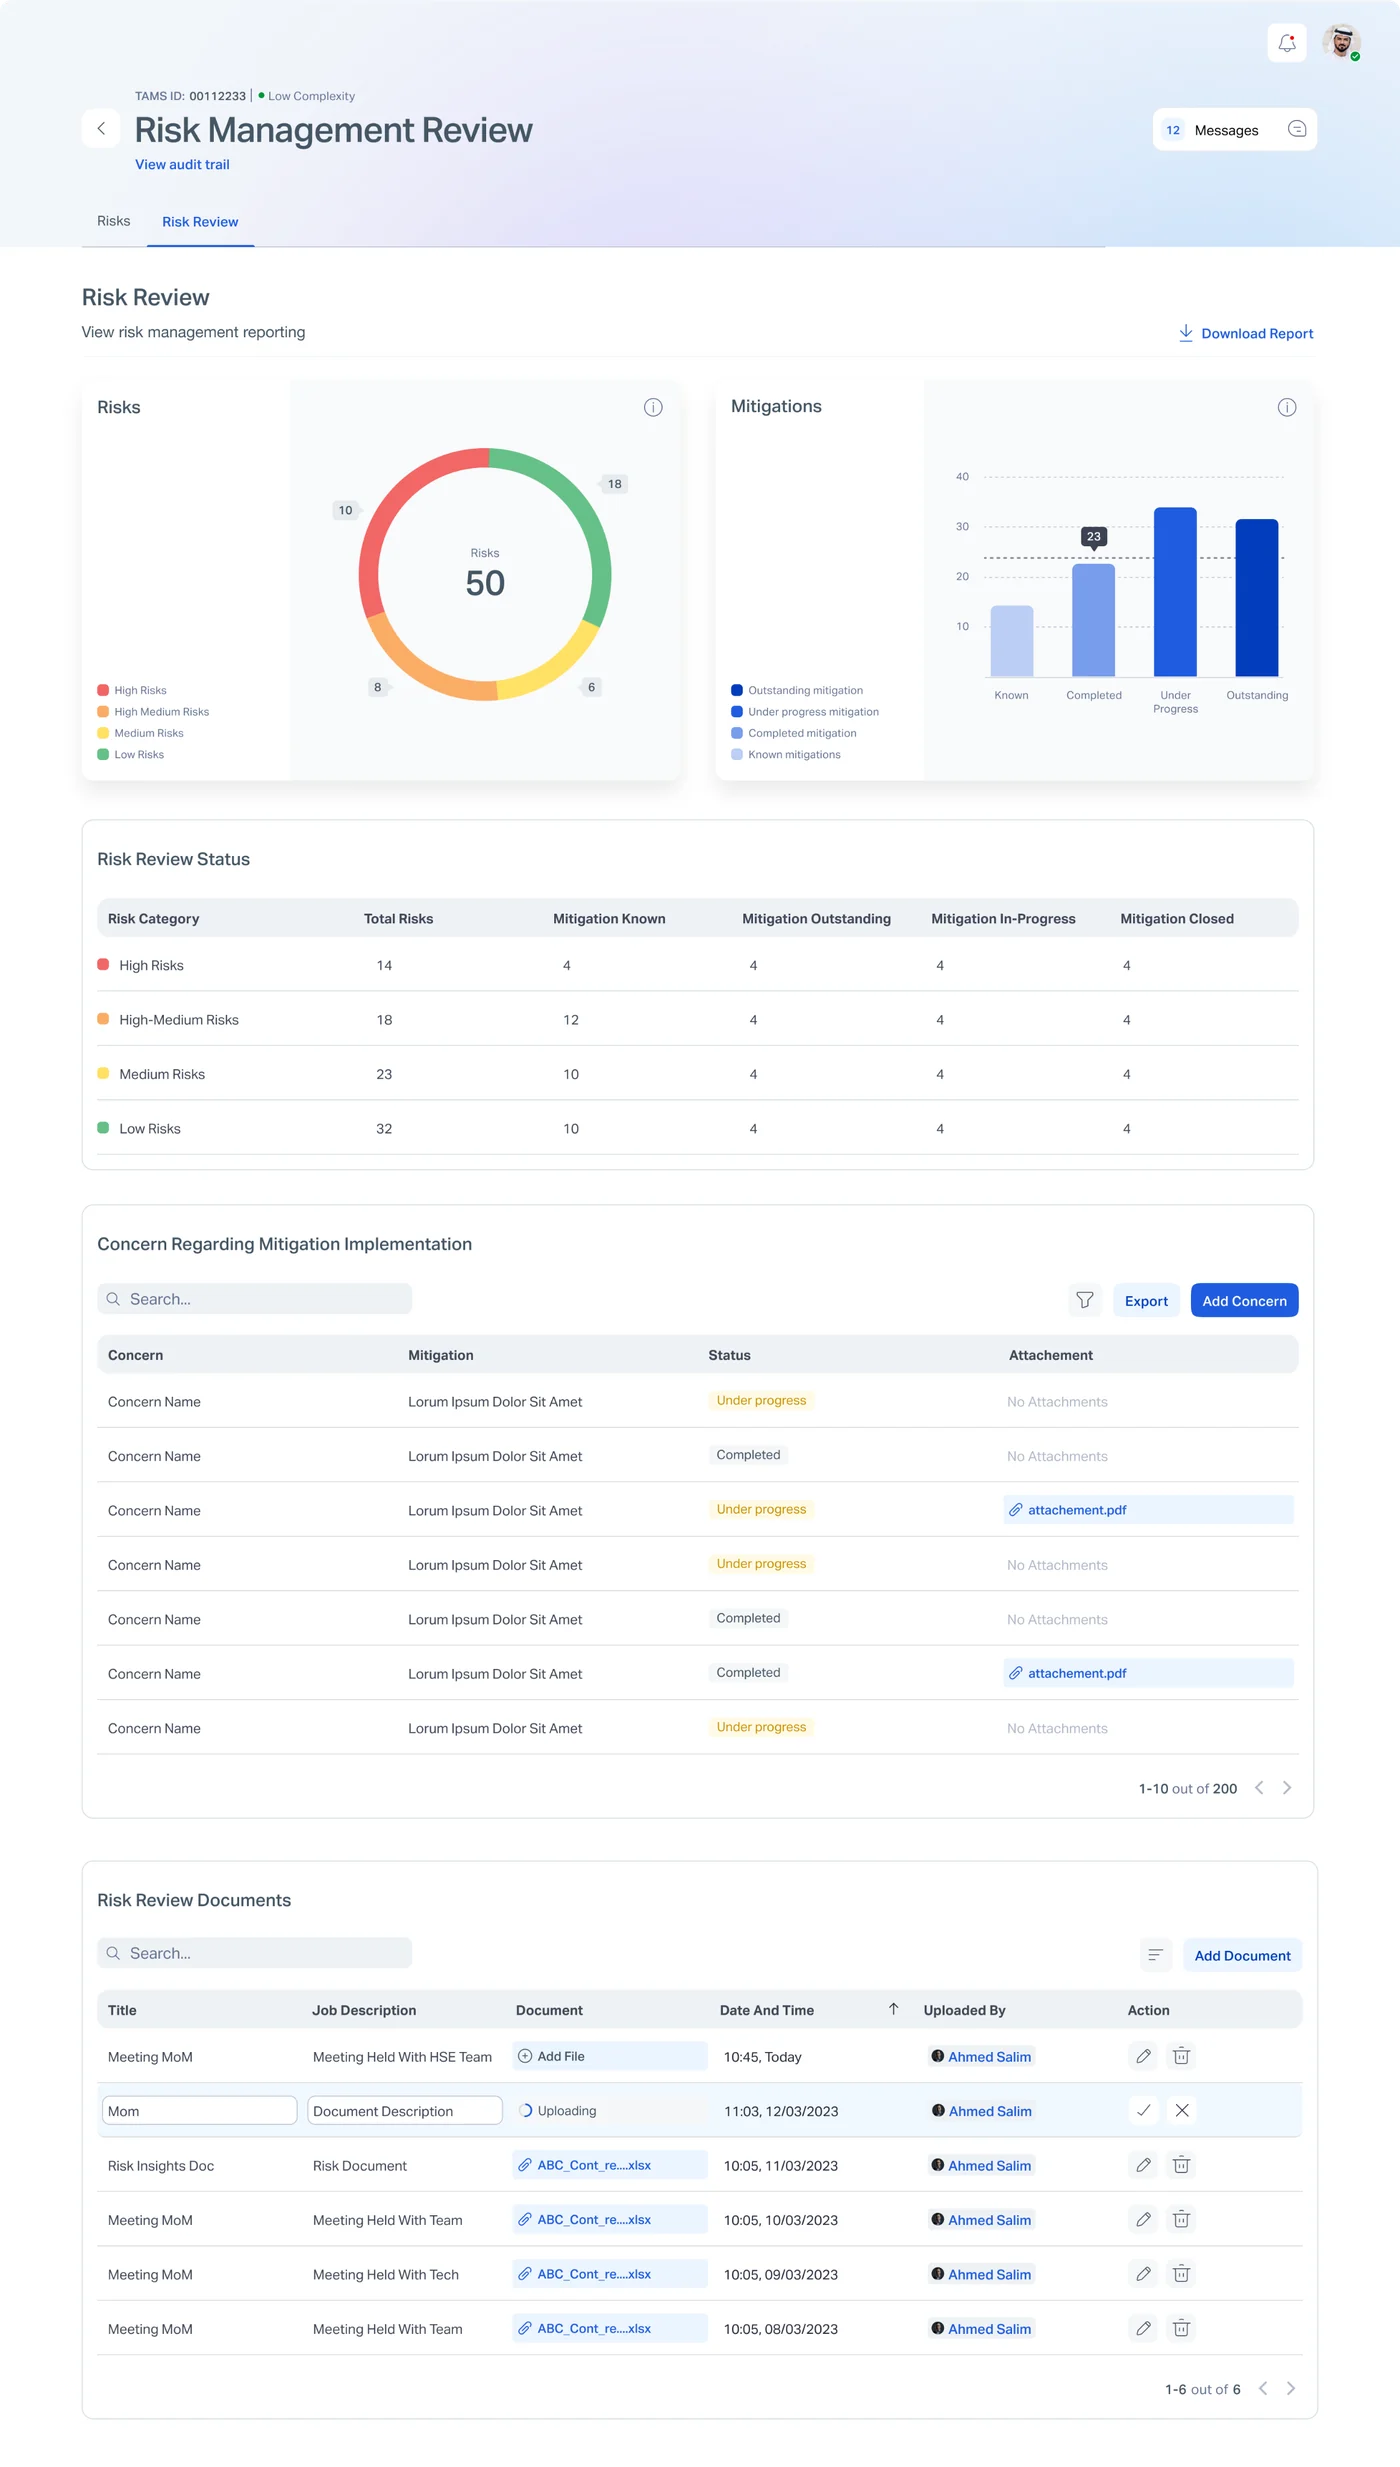
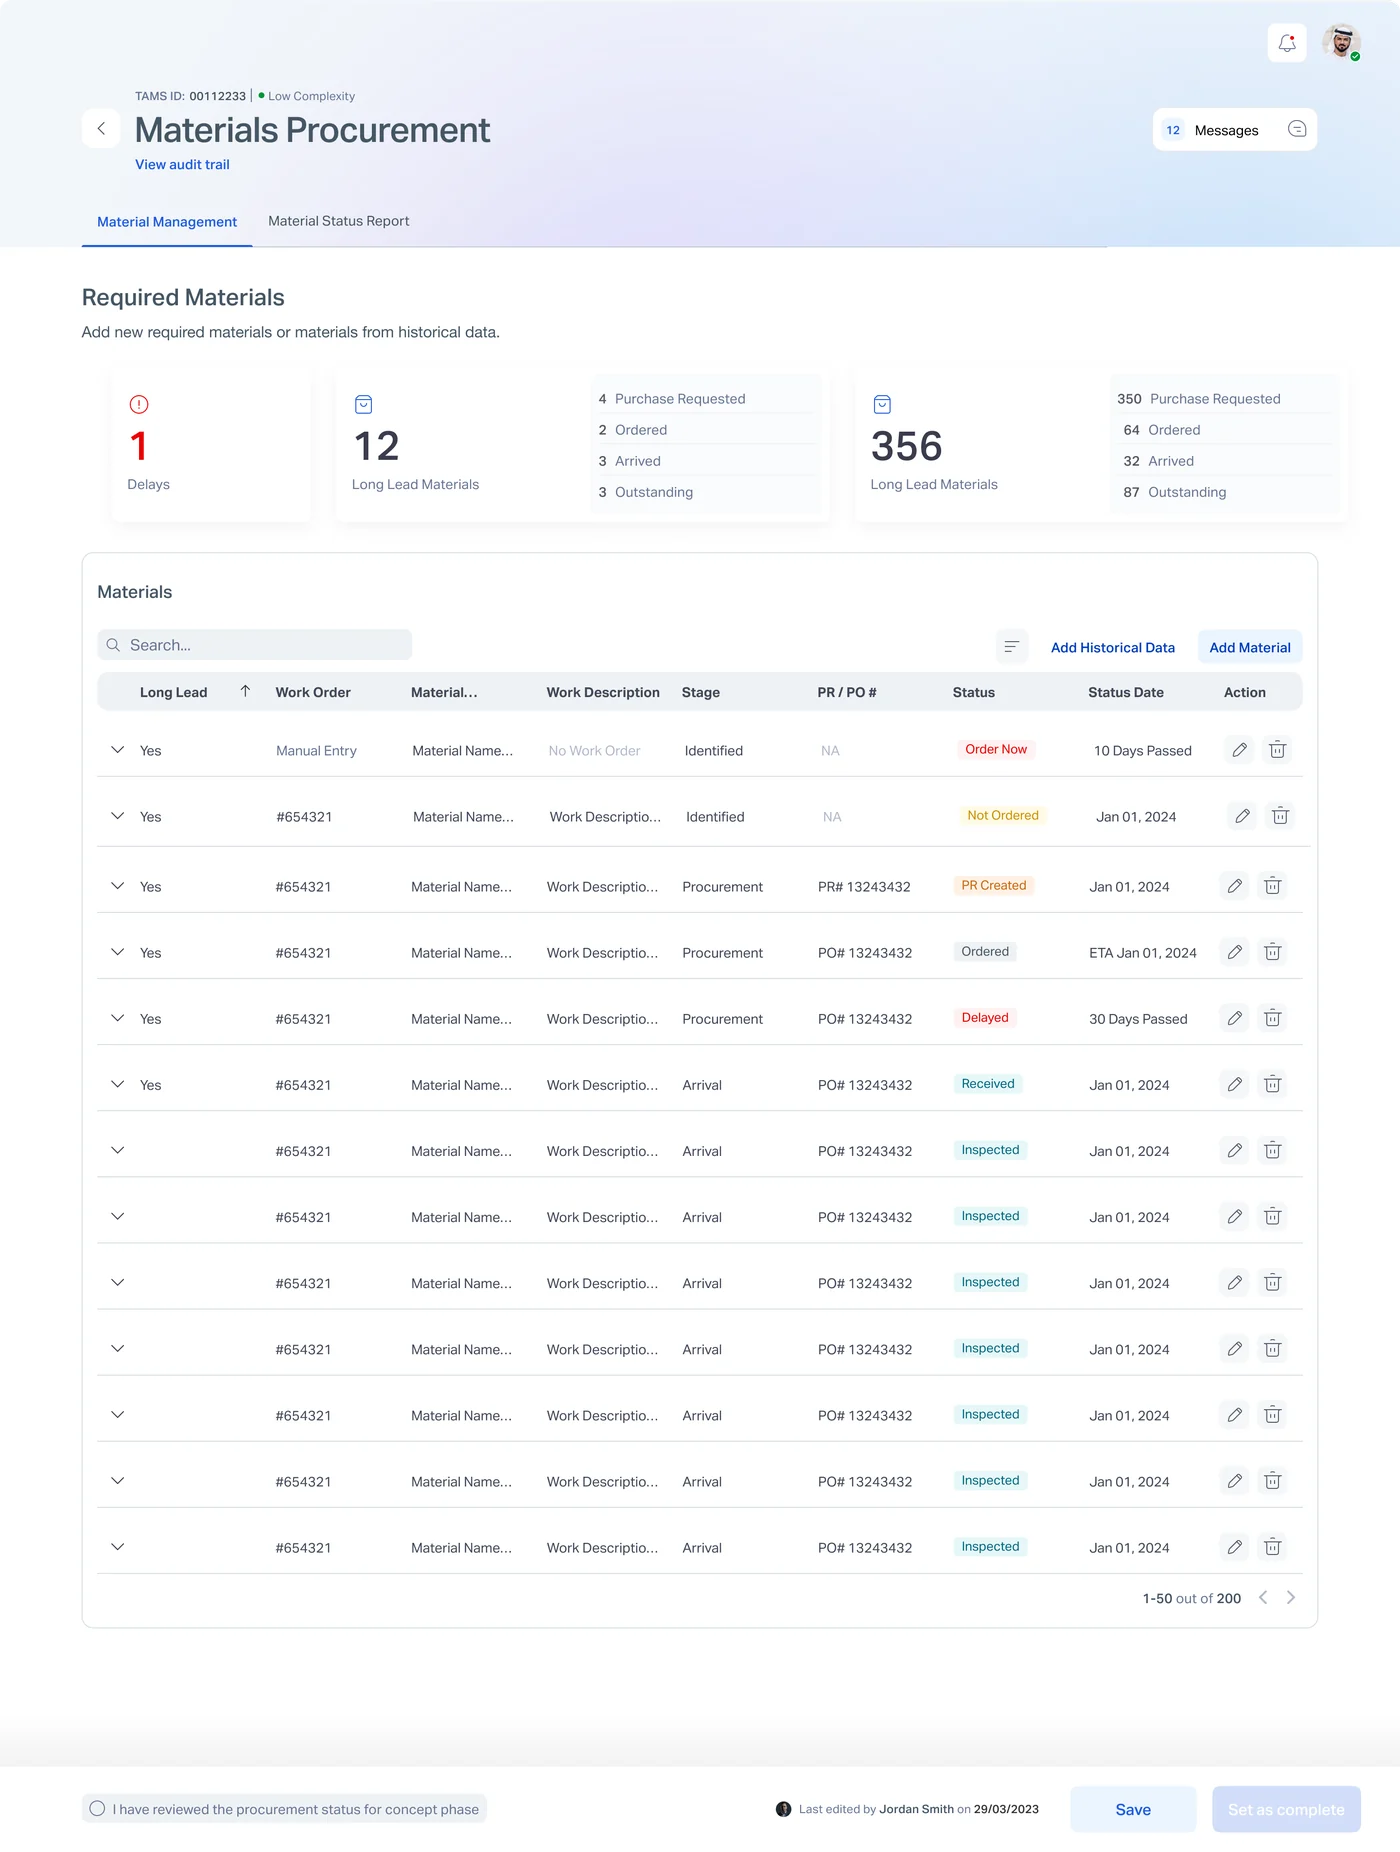
Some processes pull data from systems like SAP for the team to confirm; report pages turn process data into dashboards.
Risk management reviewRisk score, mitigation status and review history.
Materials procurementRequired materials, synced and confirmed by the team.
High-fidelity flows
Four journeys, screen by screen.
The end-to-end flows behind a turnaround: proposing a budget, approving it, scoping the request and planning the phases. Each one plays through the real high-fidelity screens.
Proposing a turnaround budget
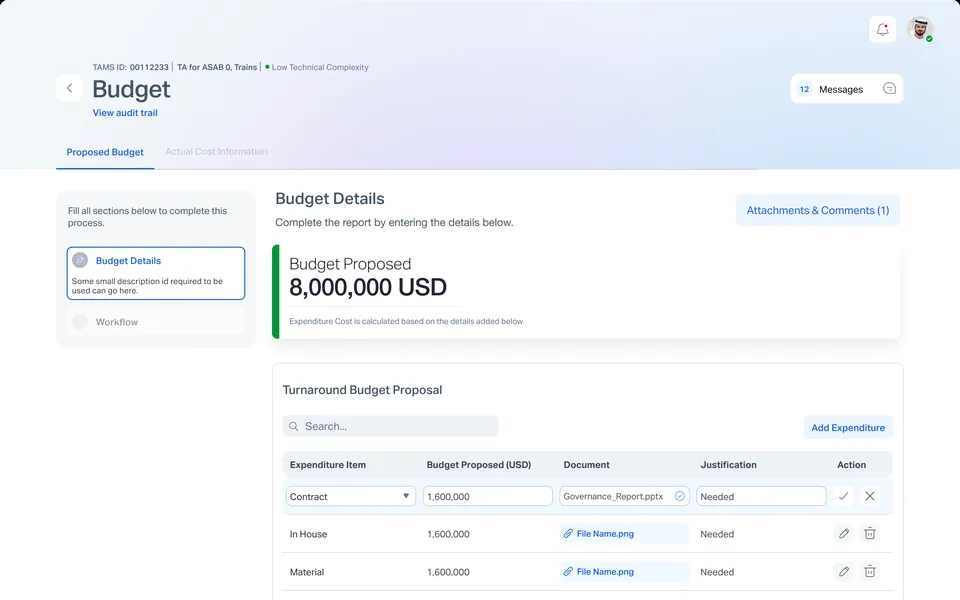
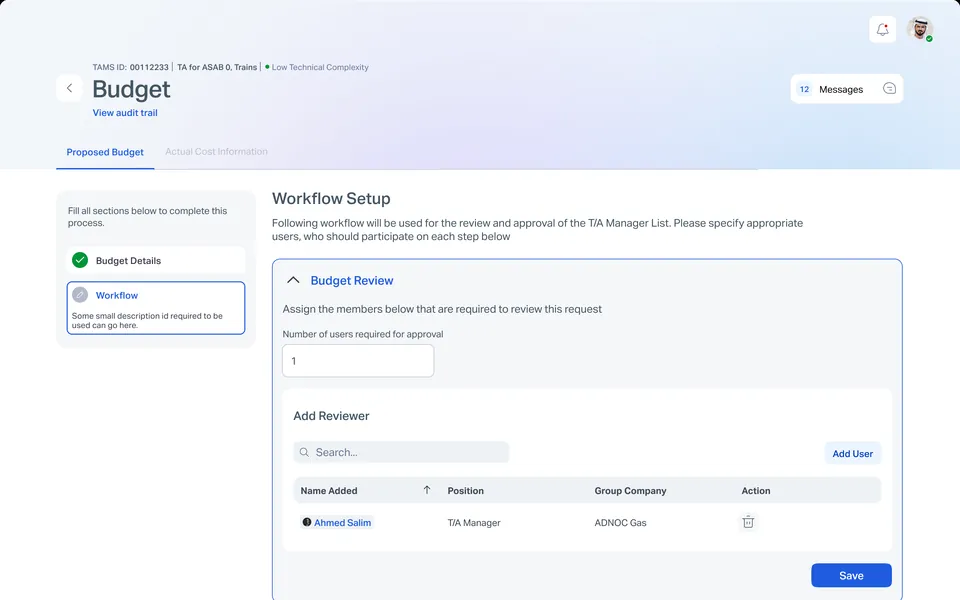
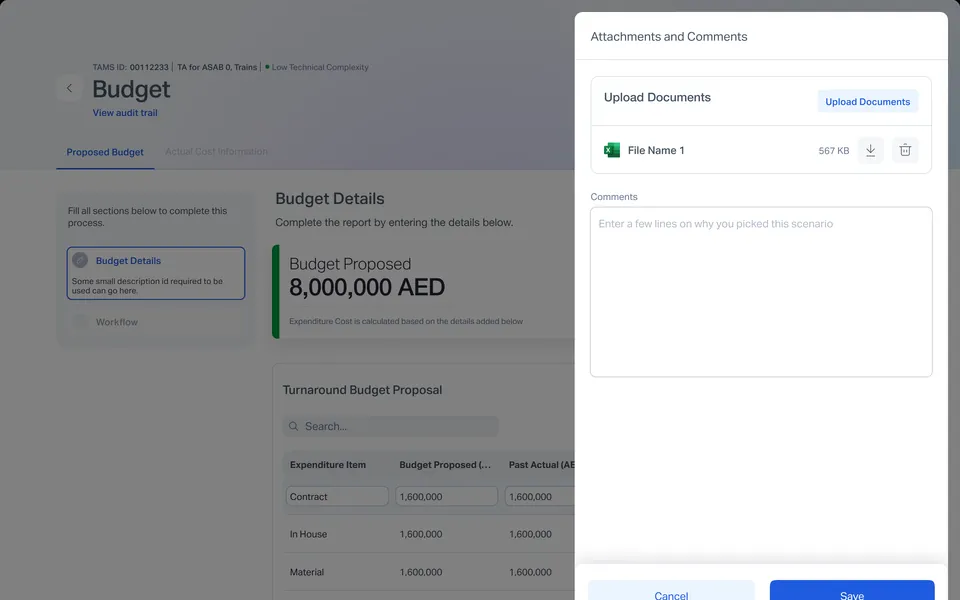
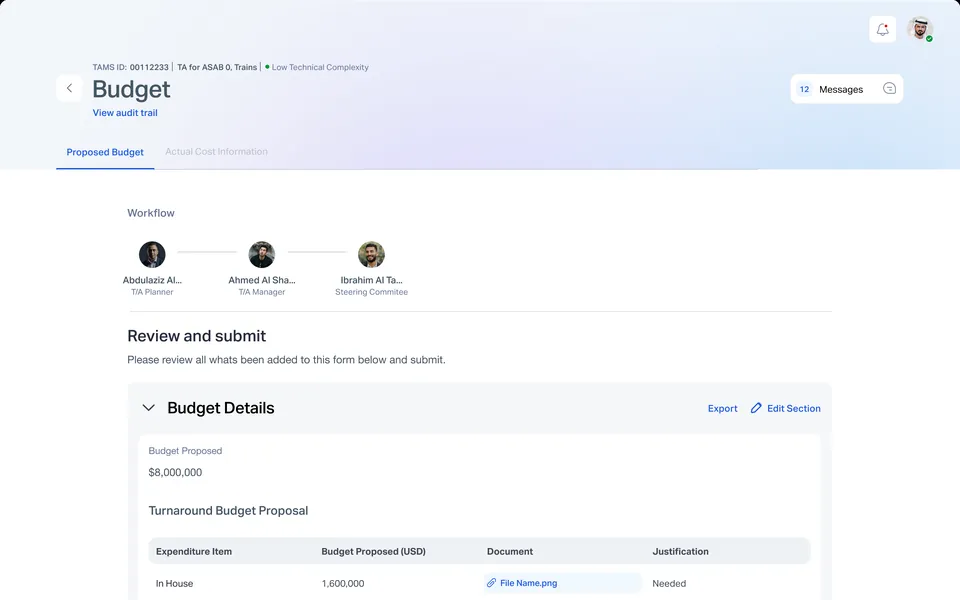
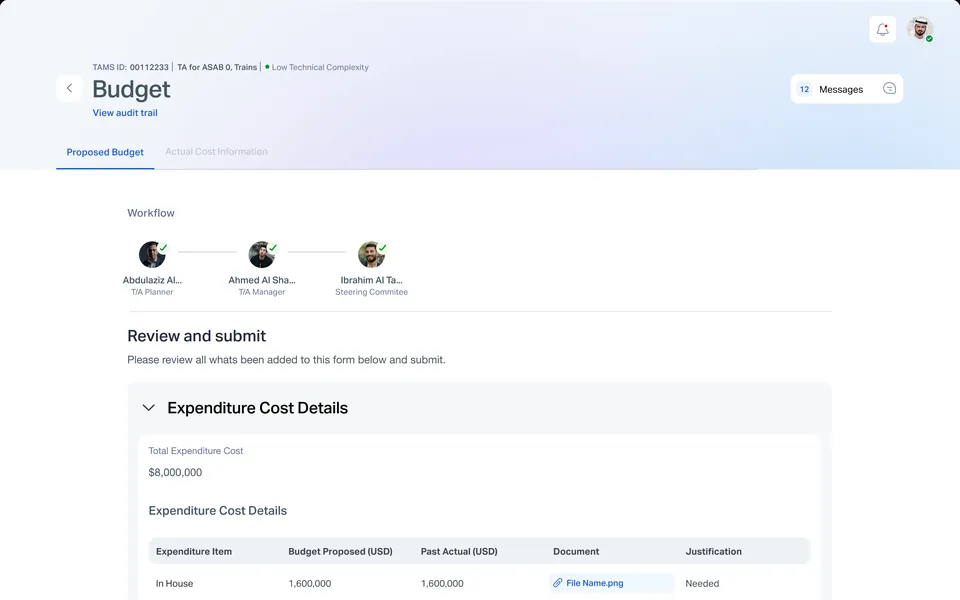
Expenditure items, documents and justification live in one editable table. Attachments, comments and the review workflow are set up before submitting.
Budget details
Attachments & comments
Workflow setup
Review and submit
Reviewer activity
Reviewing and approving a budget
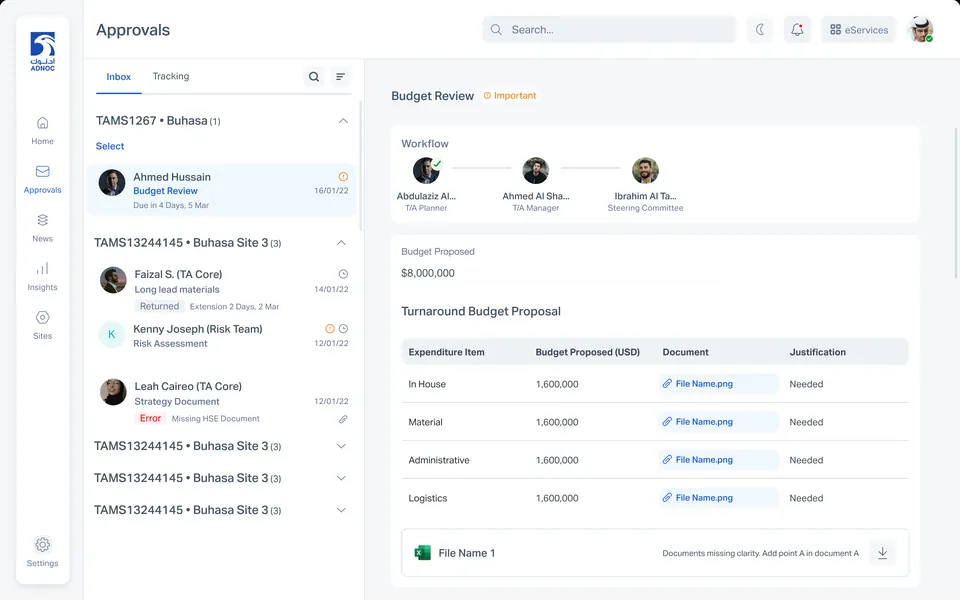
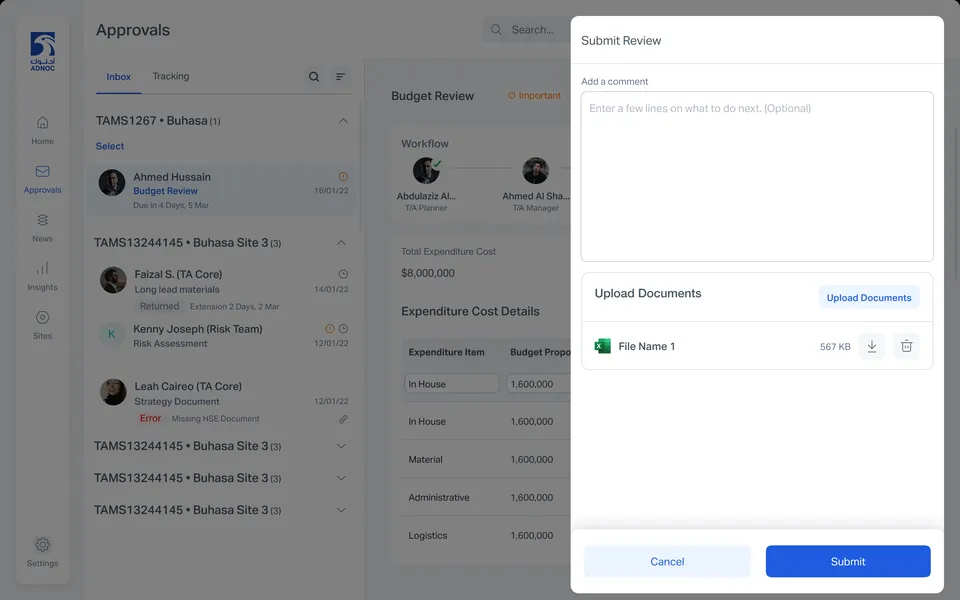
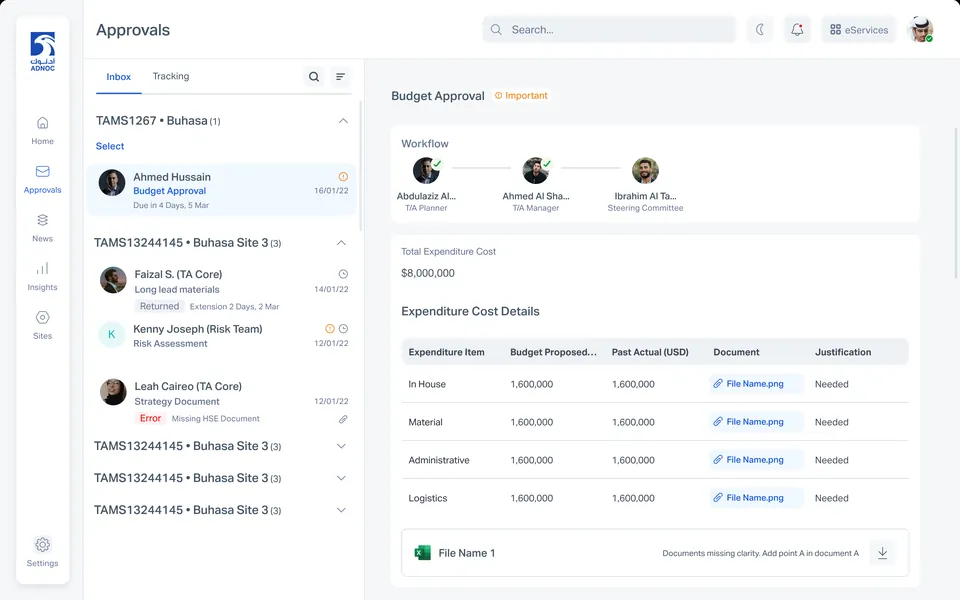
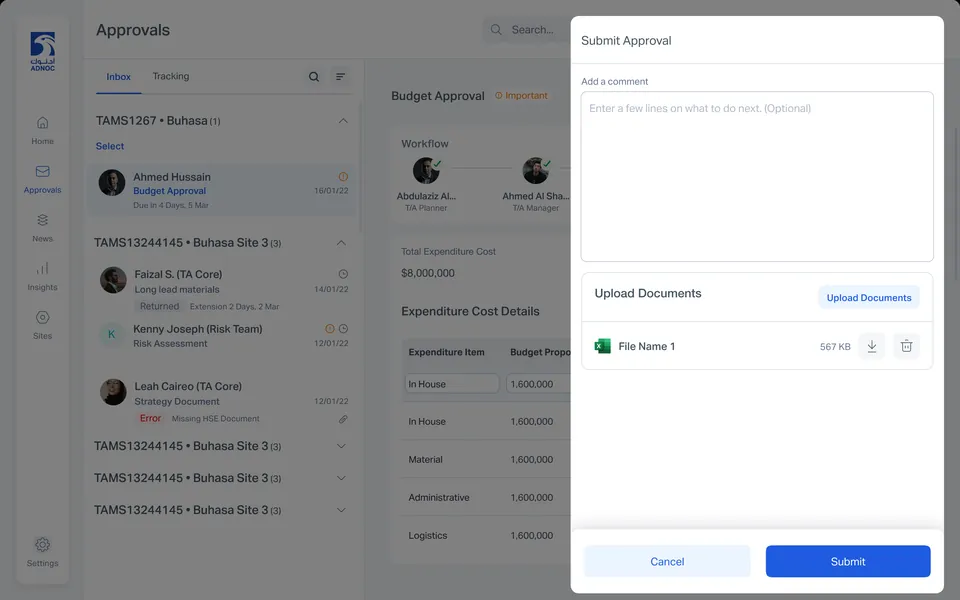
The reviewer and approver see the workflow, the proposal and every document in one pane, and act with a comment and supporting files.
Budget review
Submit review
Budget approval
Submit approval
Scoping a new turnaround
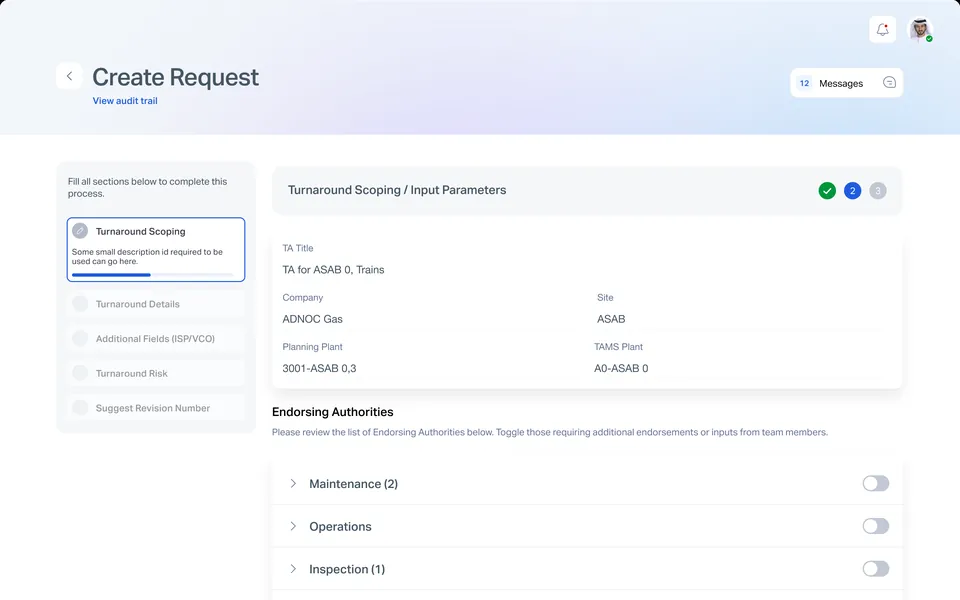
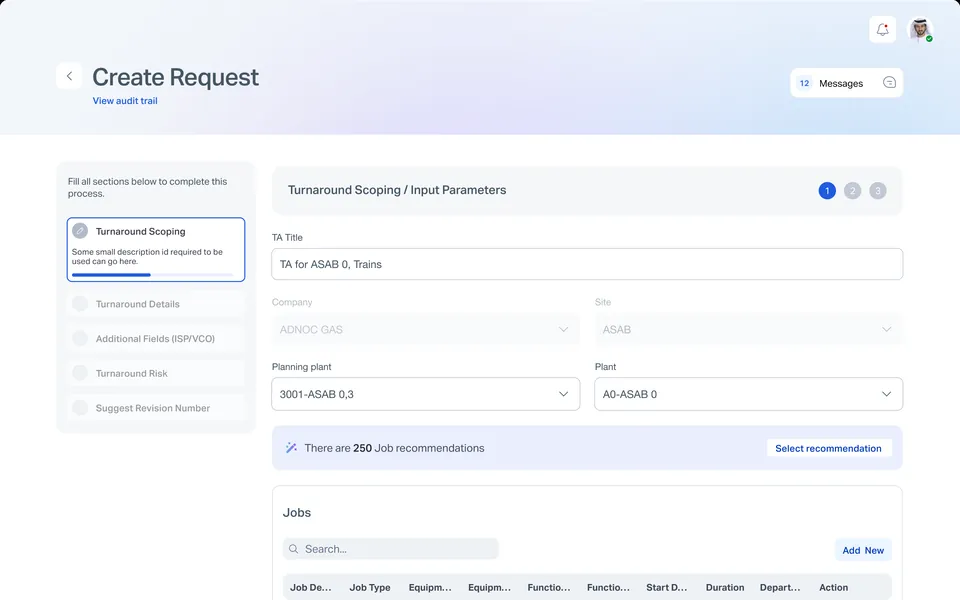
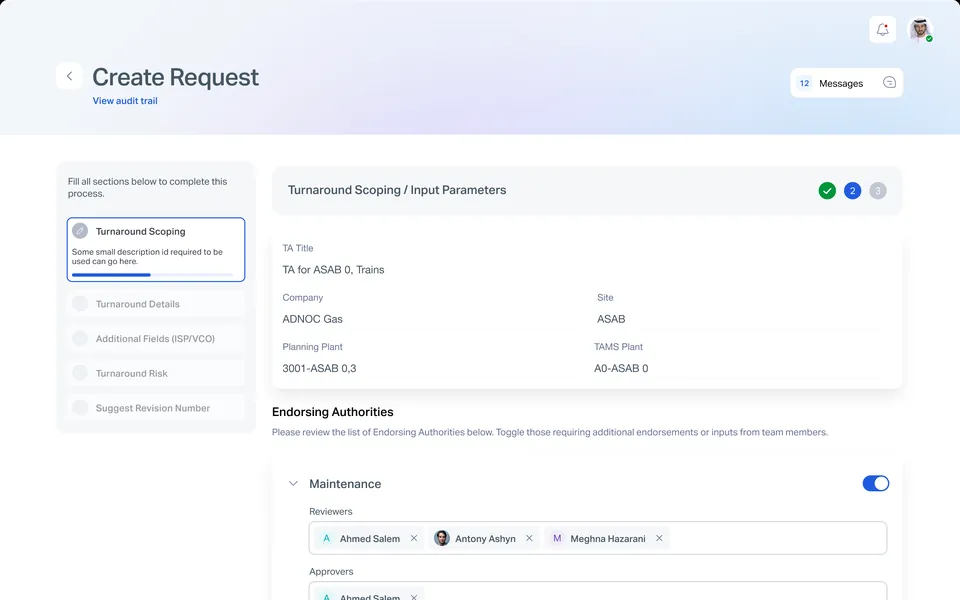
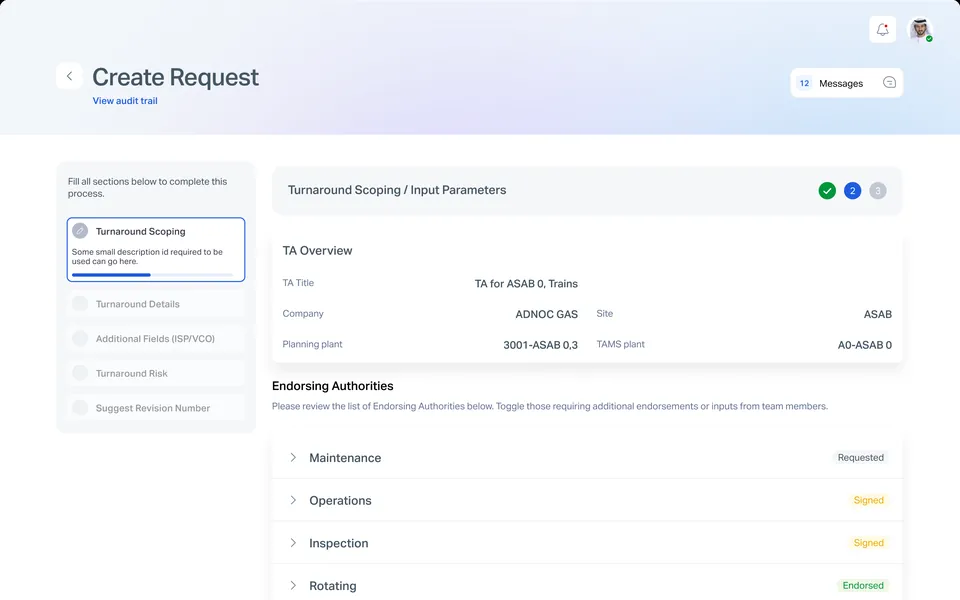
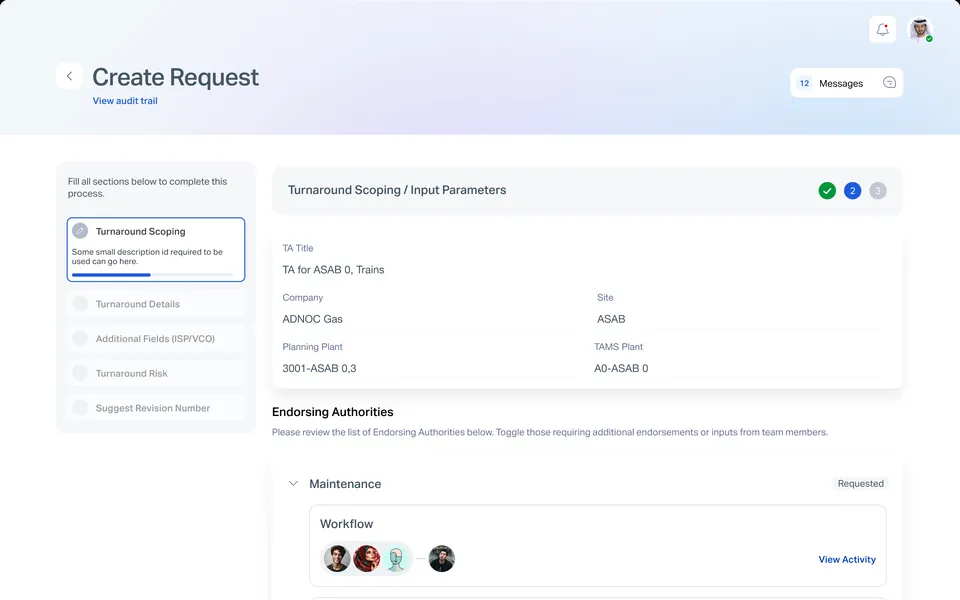
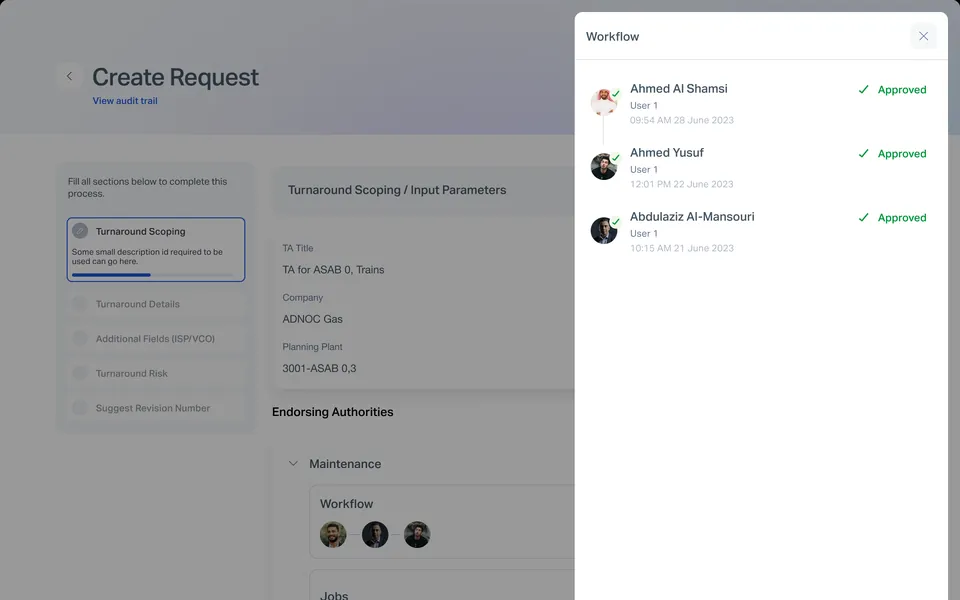
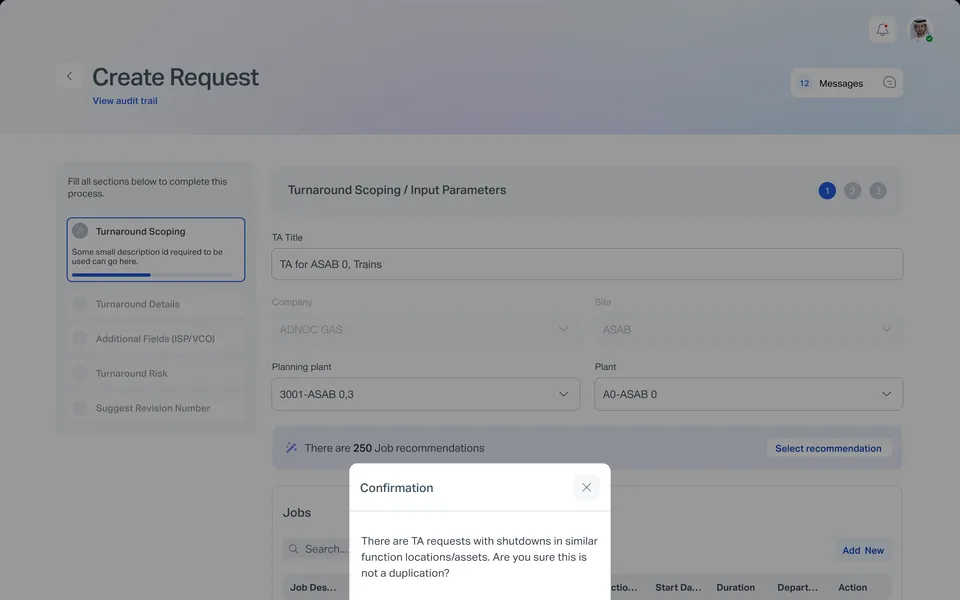
Site and plant come in first, then endorsing authorities, jobs and functional locations. TAMS flags similar shutdowns before a duplicate is created.
Scoping parameters
Jobs and locations
Authority inputs
Endorsement status
Workflow panel
Duplicate check
Planning the turnaround phases
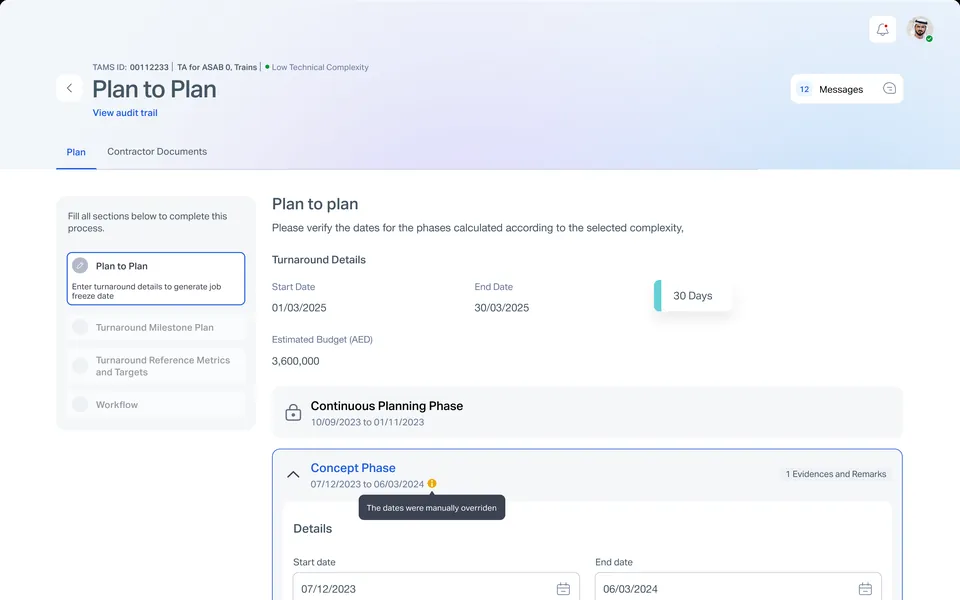
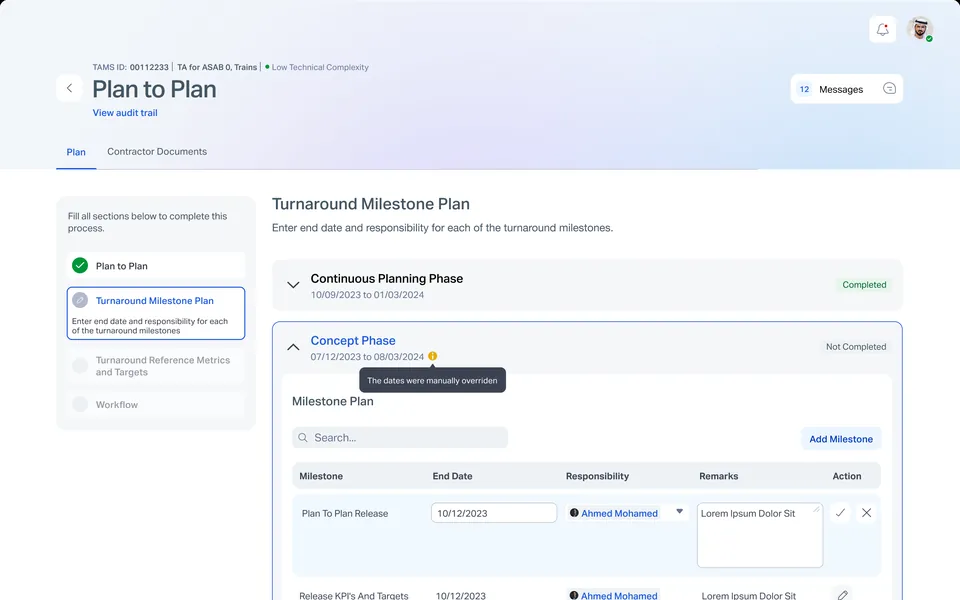
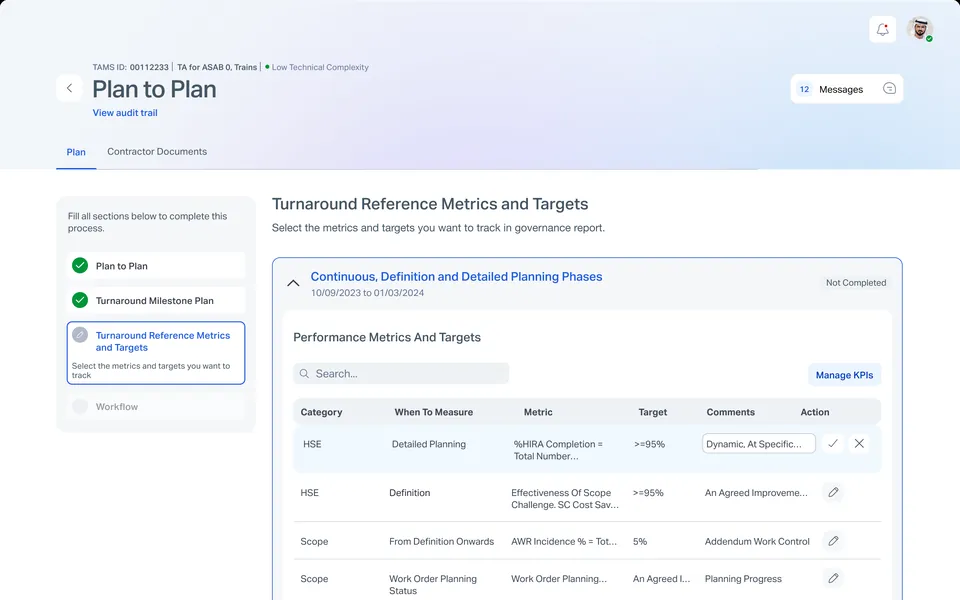
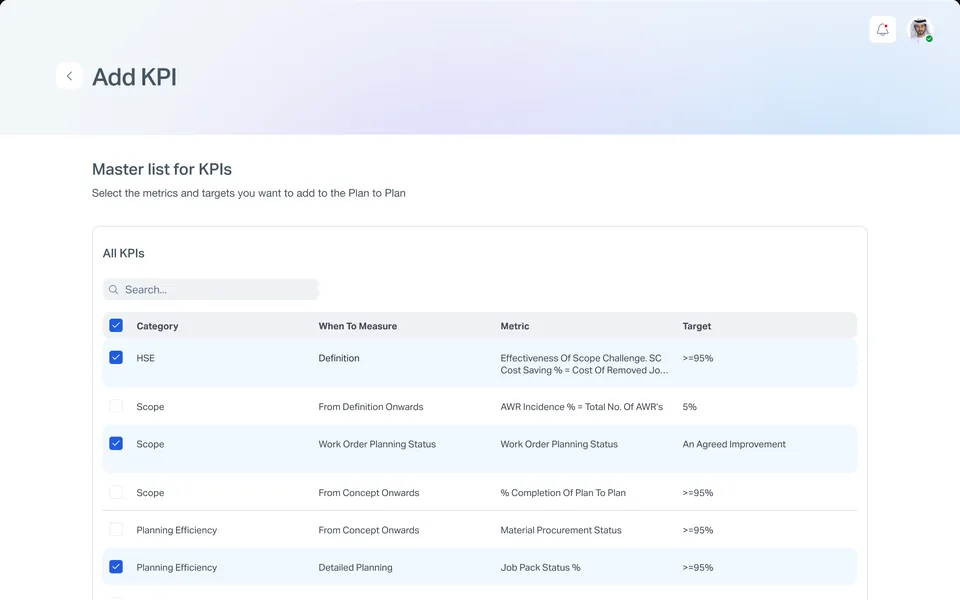
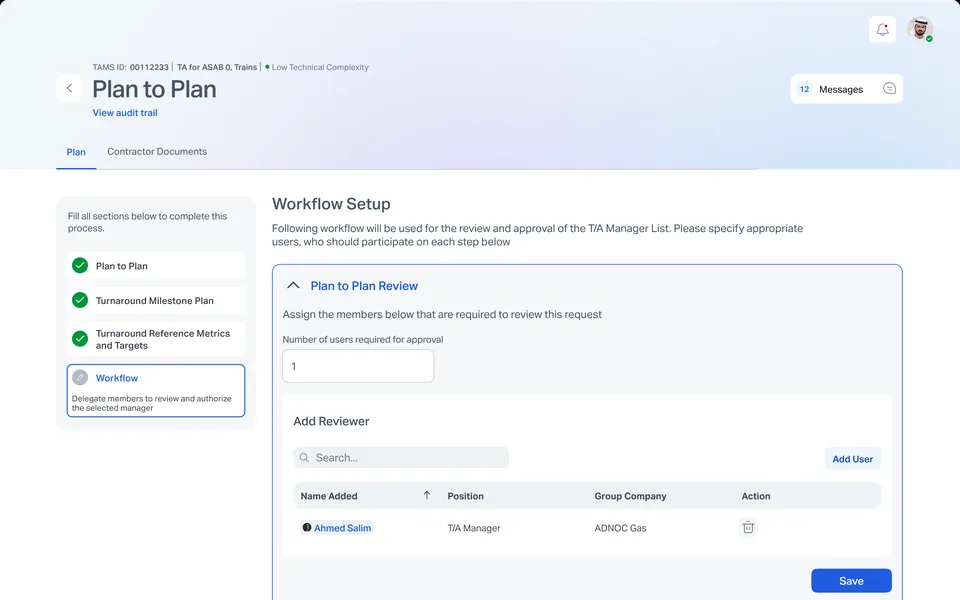
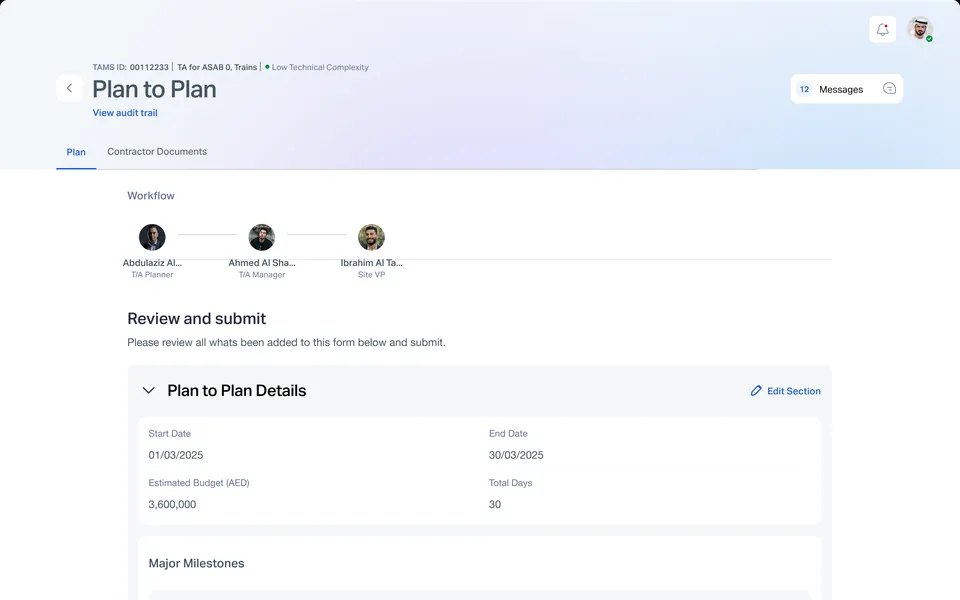
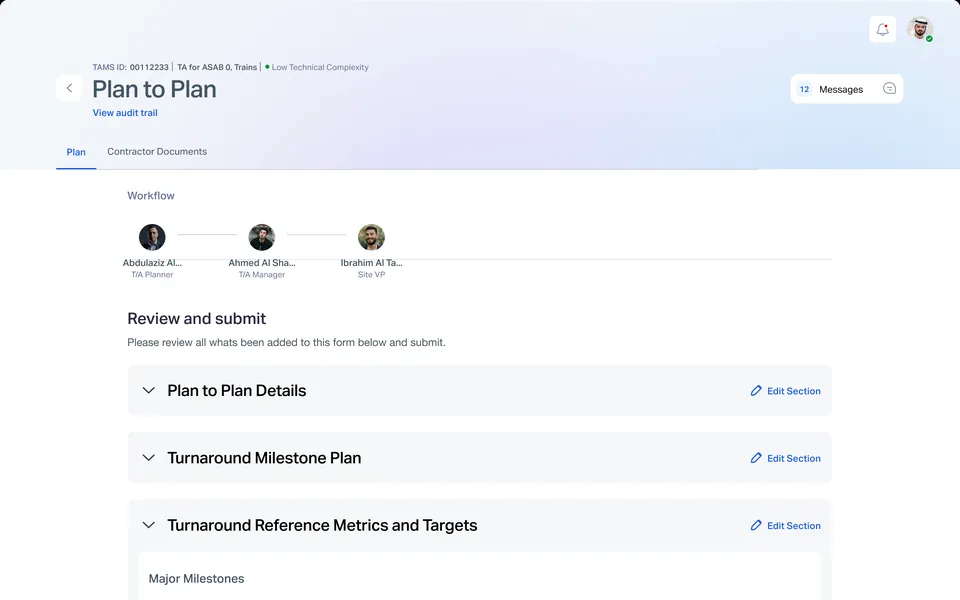
Phase dates are calculated from the chosen complexity, then milestones, KPIs and targets are set before the plan goes for approval.
Phase dates
Milestone plan
Metrics and targets
Add KPI
Workflow
Review and submit
Screen gallery
Every screen from these flows. Scroll sideways, and click any screen to see it full length.
All turnarounds dashboard
Budget details
Budget workflow setup
Attachments & comments
Budget review
Submit review
Budget approval
Submit approval
Budget review and submit
Reviewer activity
Scoping parameters
Jobs and locations
Authority inputs
Endorsement status
Authority detail
Workflow panel
Duplicate check
Plan to Plan: phase dates
Milestone plan
Metrics and targets
Add KPI
Plan workflow
Plan review
Plan review, expanded
Design system
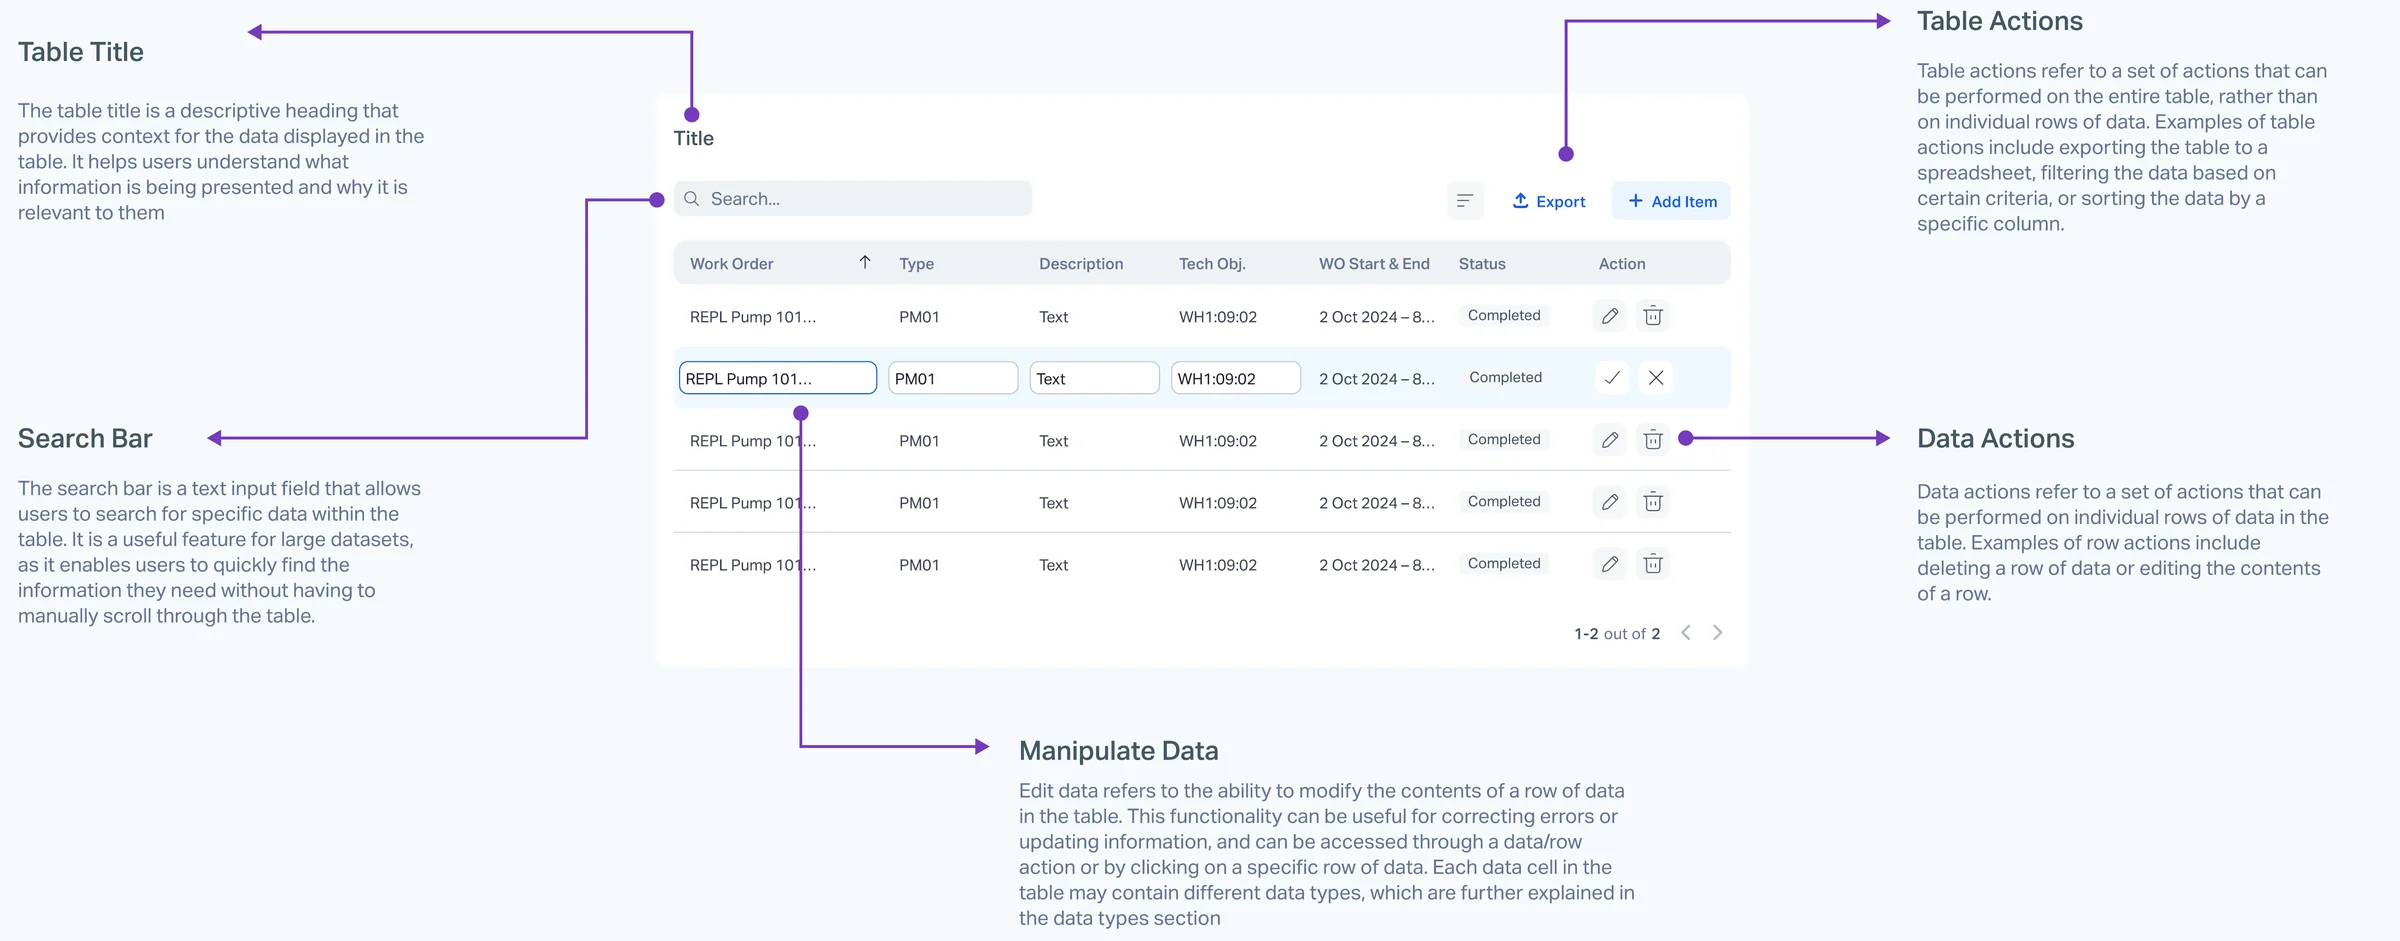
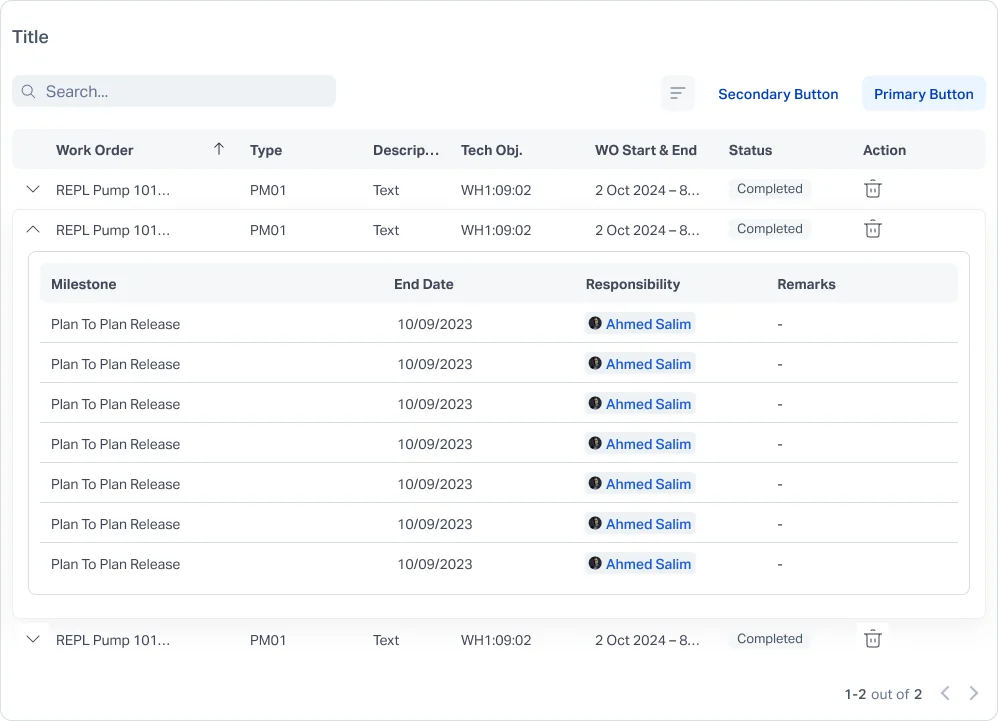
An enhanced table, built for dense, editable data.
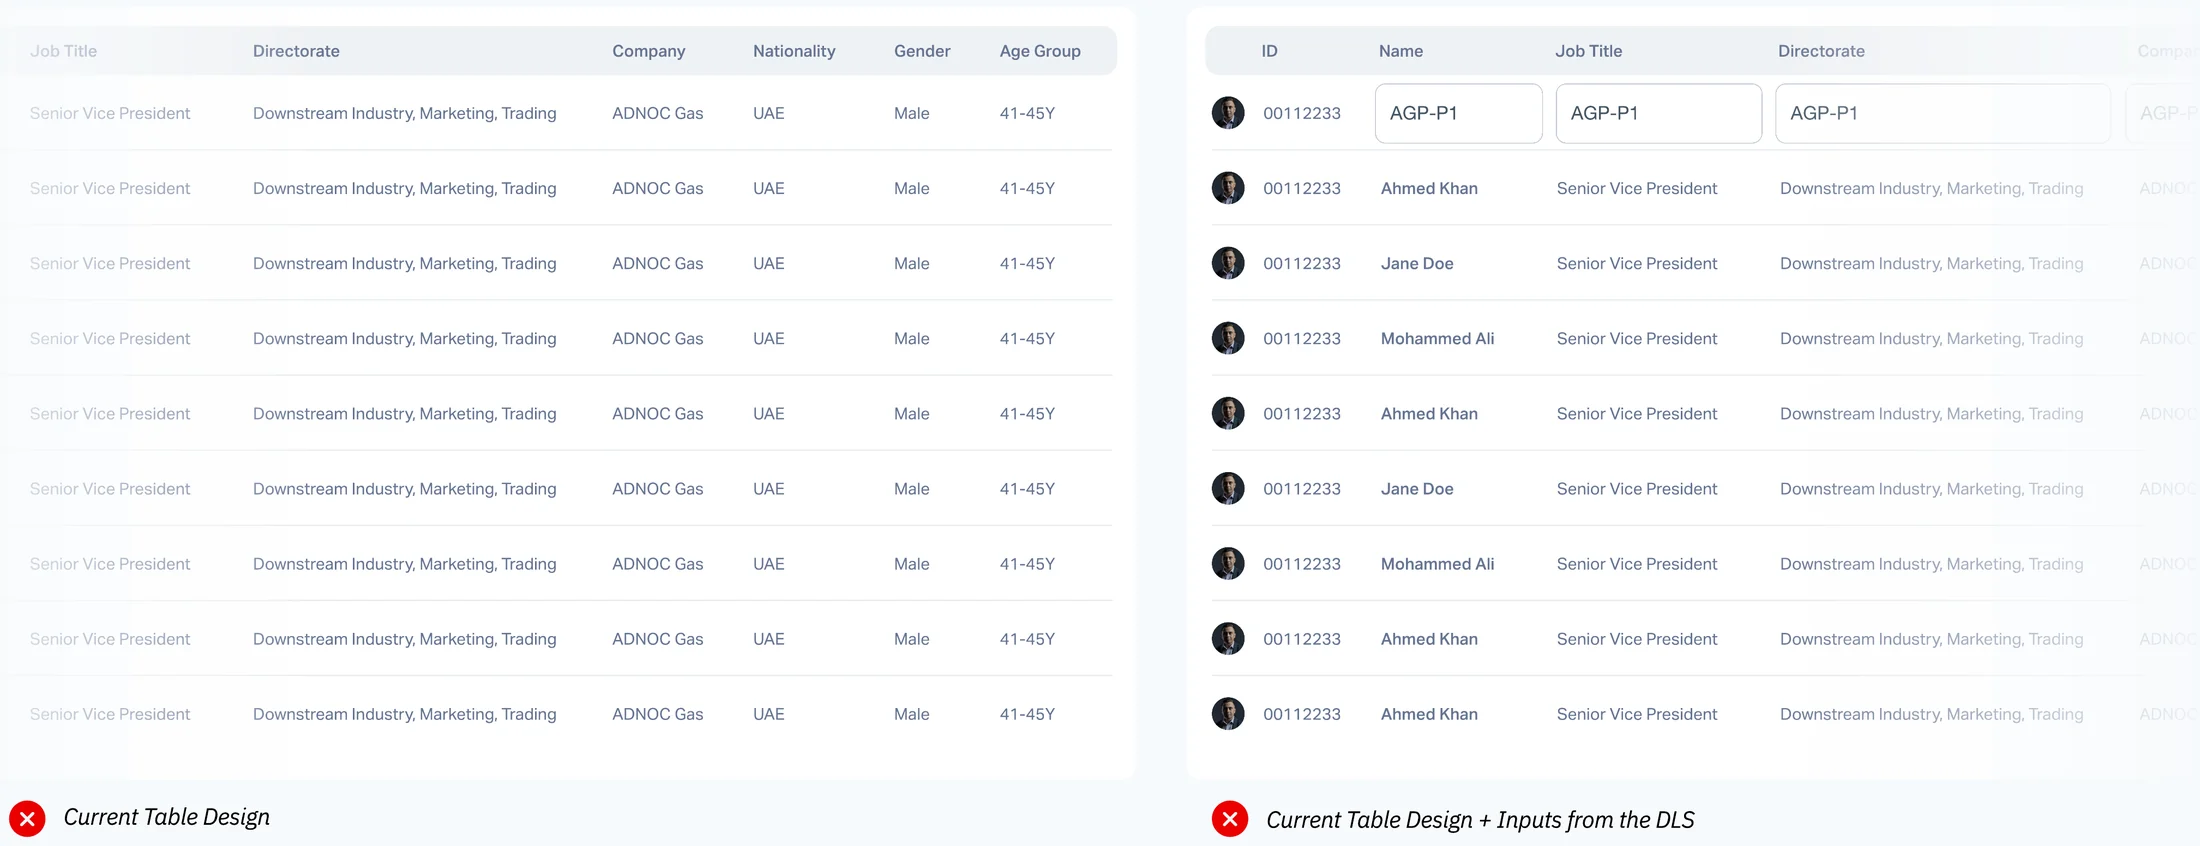
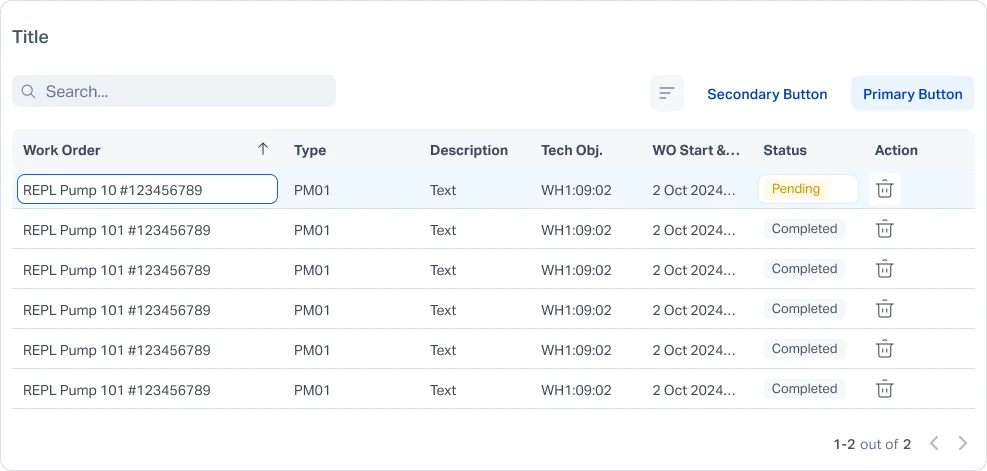
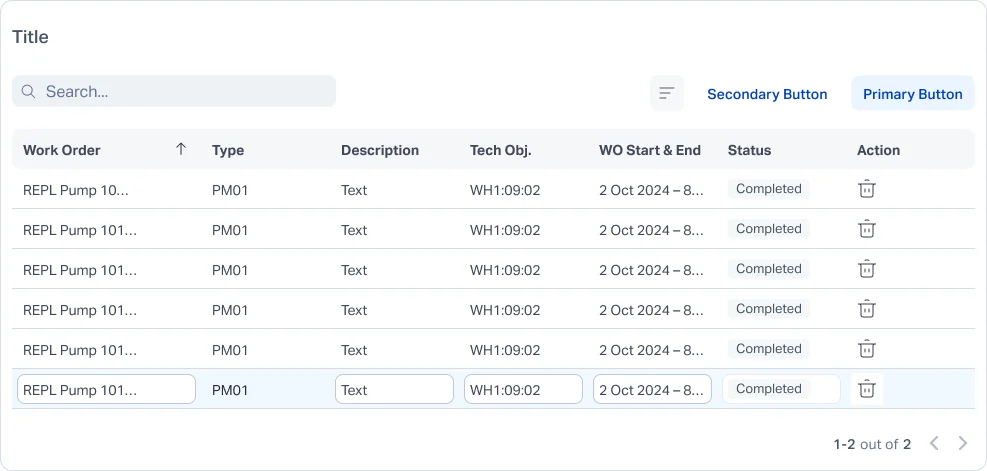
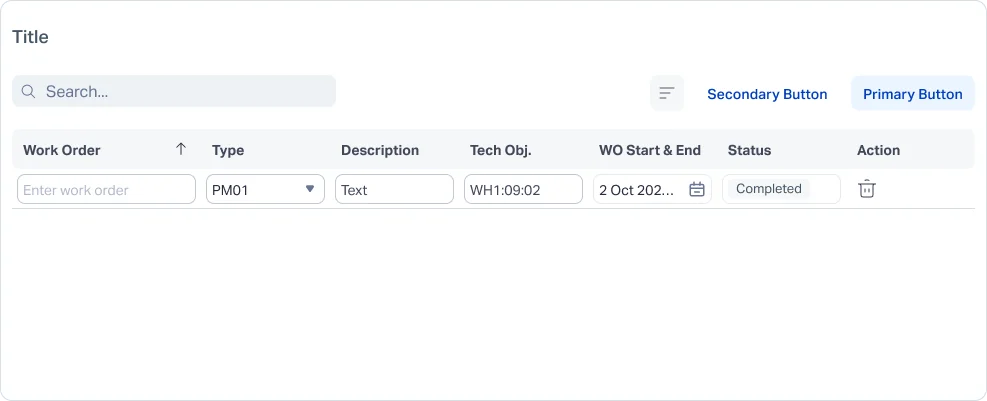
The existing ADNOC DEEX table couldn't handle editing: input fields were too big and rows too tall. We rebuilt it as a modular component with inline editing, search, sorting, pagination and table- and row-level actions.
Before
After · anatomy
RegularEdit stateEmpty stateAccordion
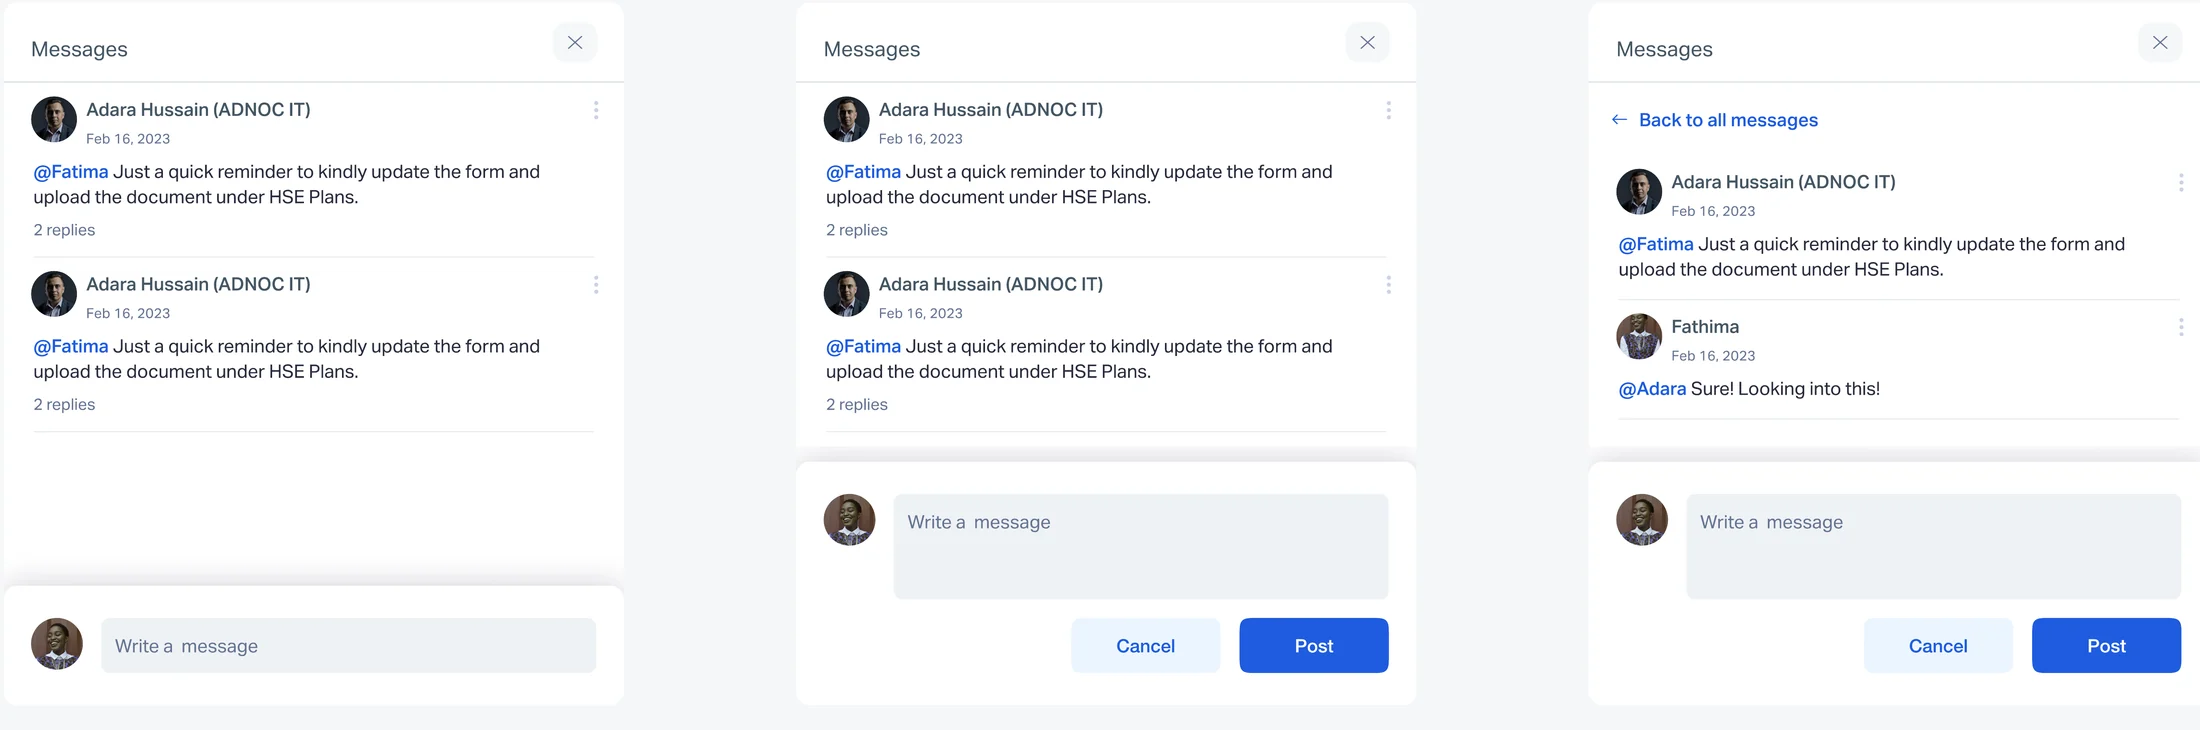
Messages widget
Notes, @mentions and threads live on each process, so collaboration stays inside the product.
Also added to the DLS
01File upload widget
02Process widget (FAT / RAT)
03Form accordion
04T/A summary widget
05Multi-level Gantt chart
06AI insights alert
Mobile
Desktop to do the work. Mobile to keep it moving.
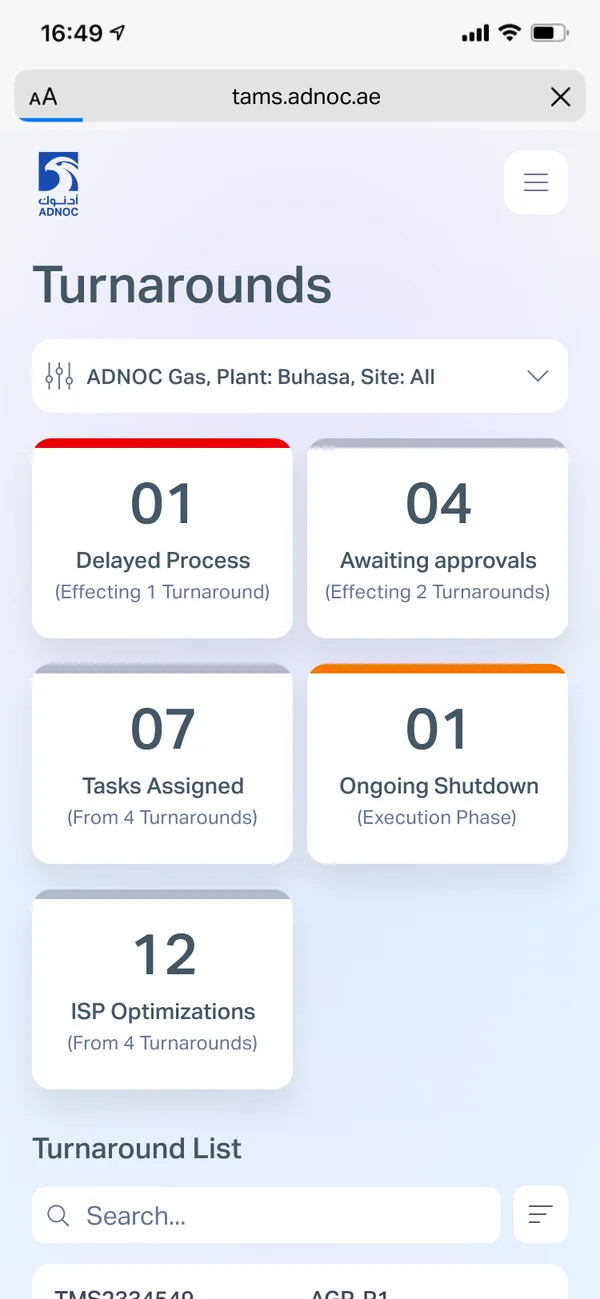
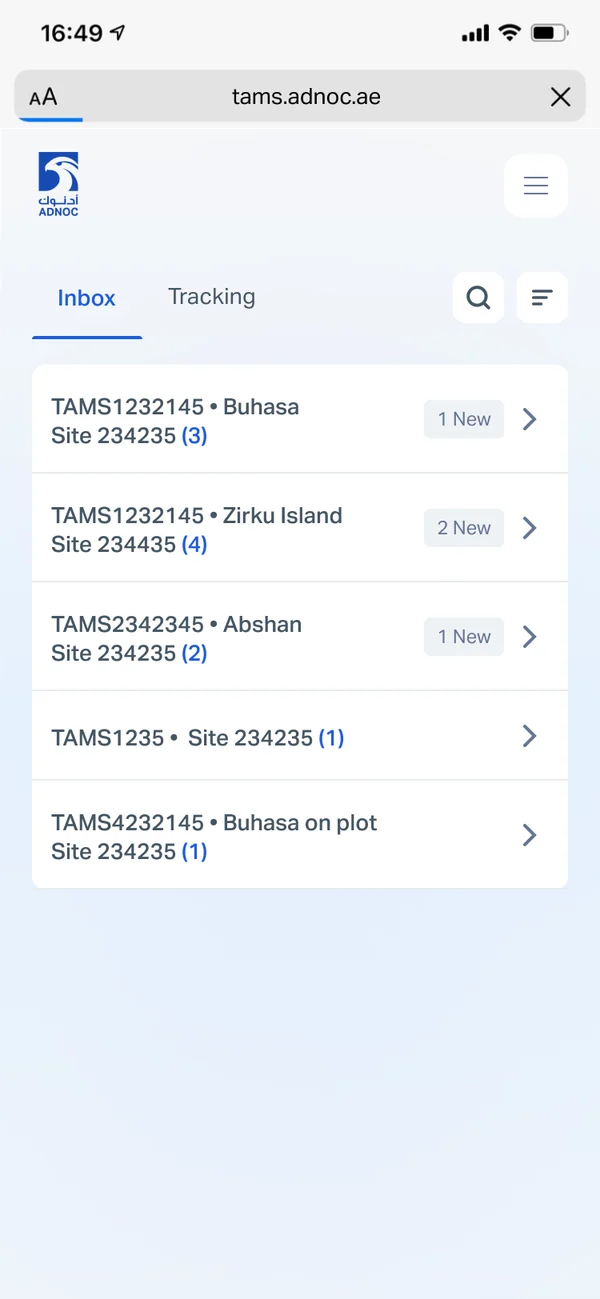
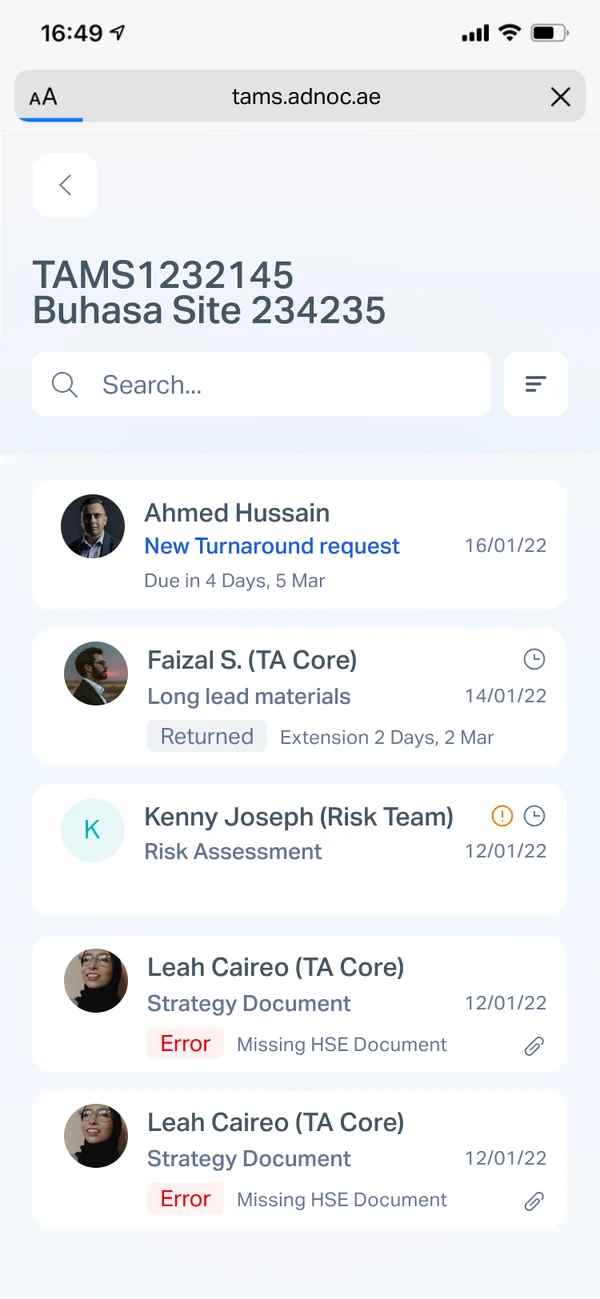
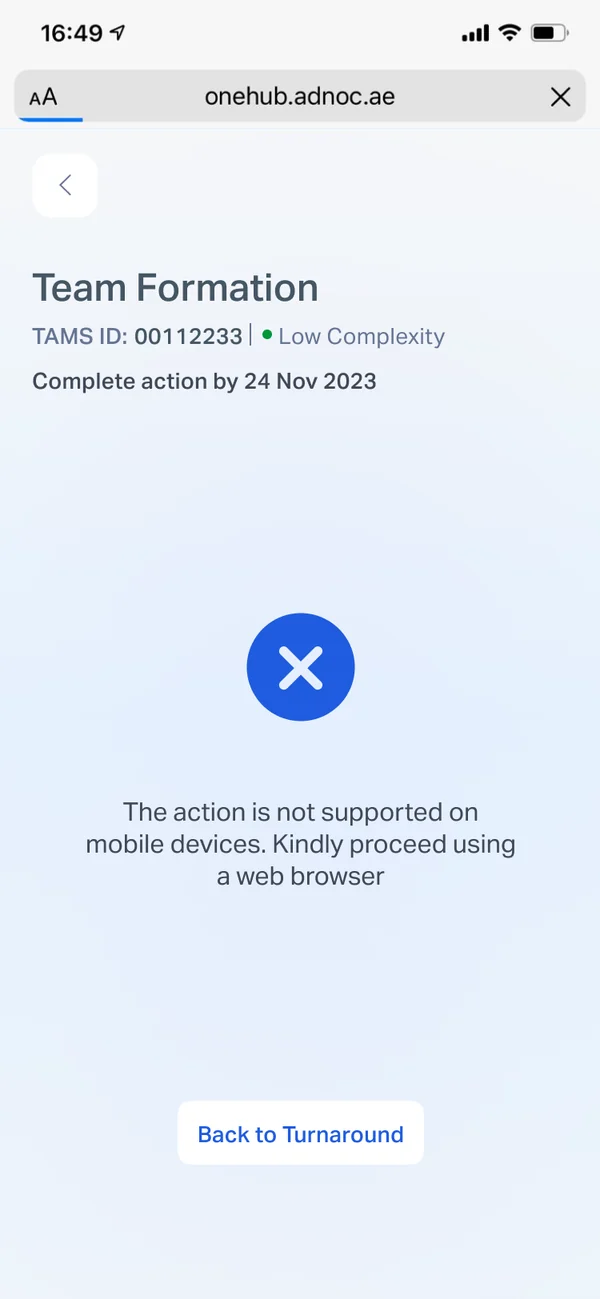
TAMS relies on large tables, which are tedious on small screens. So mobile is deliberately limited to tracking and manager approvals, with processes shown read-only.
Manager view
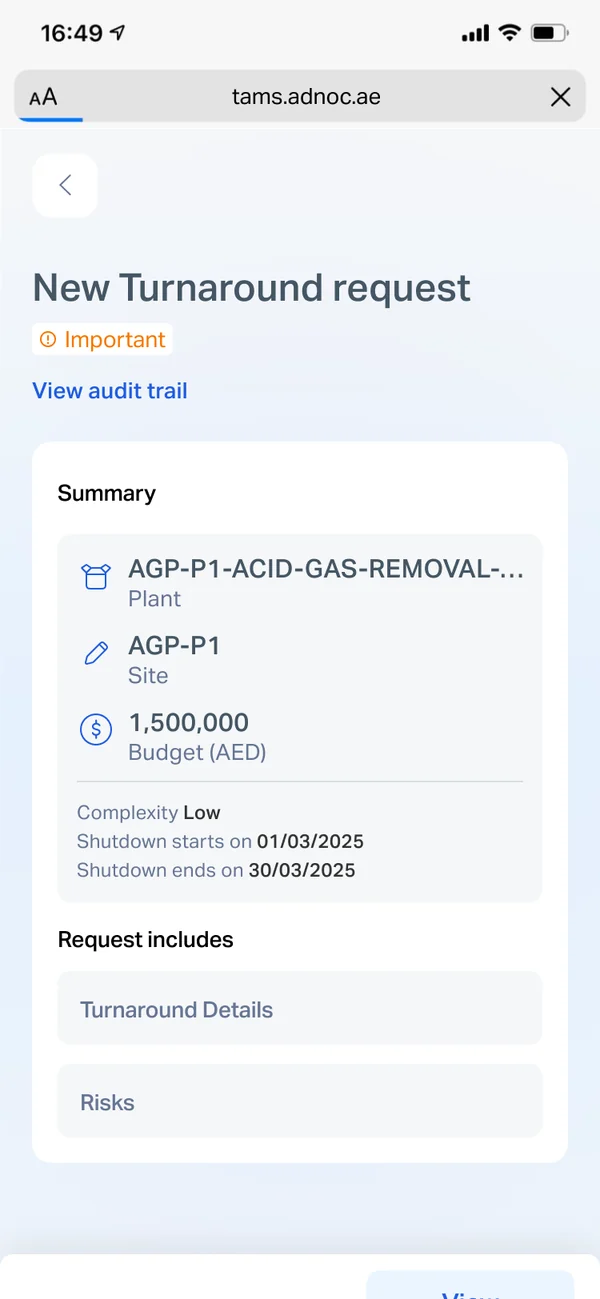
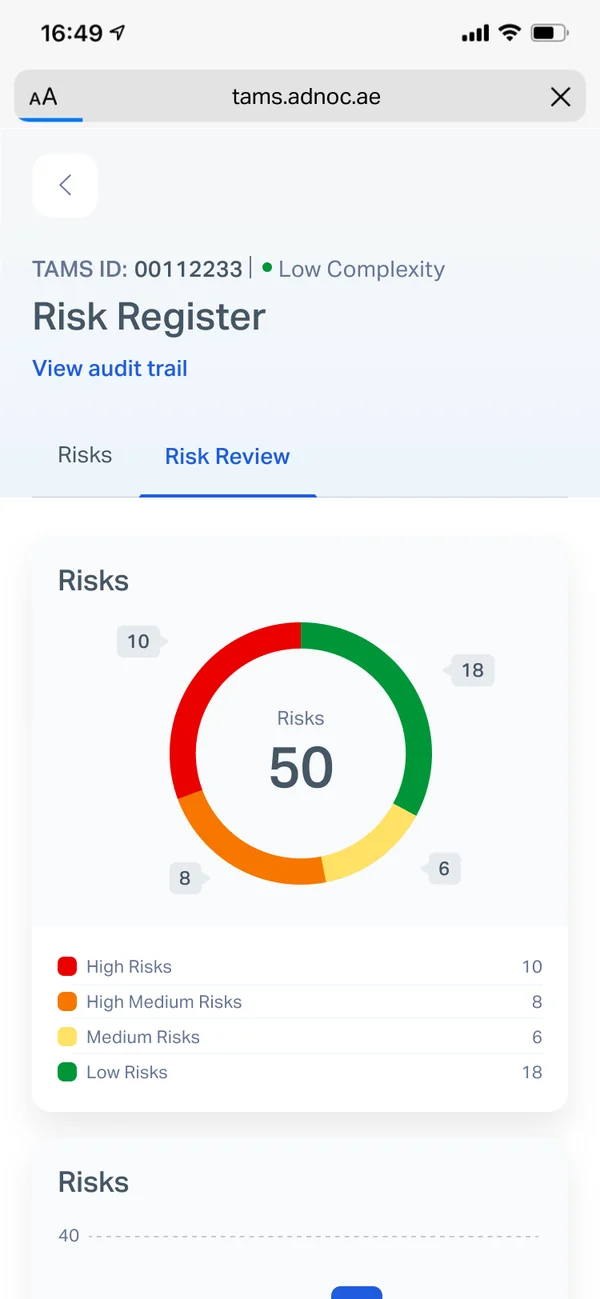
An inbox grouped by site leads to the request summary, the risk register and a sticky Approve / Reject / Return bar.
InboxRequests by site
Site approvalsStatus, errors, due dates
Request summaryKey facts first
Risk registerScores and mitigation
Guarded editingIncomplete forms go to web
Outcome
Clarity at scale, inside enterprise constraints.
Stakeholders
Designs were positively received by stakeholders.
Standards
UI met ADNOC's enterprise standards and governance requirements.
Workflows
Contributed to improved clarity and usability across turnaround management workflows.
My contribution
Designed enterprise-grade UI screens aligned with the existing design system
Translated complex workflows into structured, scannable layouts
Maintained visual and interaction consistency across core modules
Collaborated with multiple stakeholders to refine usability within system constraints